Creating Widgets from Functions
Contents
Creating Widgets from Functions#
What if we had a function in Python and could ‘magically’ just say: “Dear computer, please create a GUI for my function”?
We can ~~literally~~ almost do that with 🧙♂️magicgui! If we put some annotations right next to the variables in our function, we can create the GUI with one line of code 😻 !
In this notebook, we introduce annotations to functions. We annotate a function to allow automatic widget generation with magicgui. We then add the widget to napari and run it.
from skimage.io import imread
import matplotlib.pyplot as plt
from magicgui import magicgui
import napari
from napari.utils import nbscreenshot
from napari.types import ImageData
Annotating a function#
Consider the following function:
def preprocess_image(image, background_subtraction_radius = 15, particle_radius = 5):
    """Apply background removal and denoising"""
    from skimage.morphology import white_tophat, disk
    from skimage.filters import gaussian

    footprint = disk(background_subtraction_radius)
    background_subtracted = white_tophat(image, footprint=footprint)
    denoised = gaussian(background_subtracted, sigma=particle_radius)
    return denoised
This function has 3 input arguments: an image and 2 other integer arguments; and it returns a processed image. The function has a brief docstring that describes what it does.
As you already know by now, we can have access to this information by quering the function and getting back its signature and docstring, like this:
preprocess_image?
Signature:
preprocess_image(
    image,
    background_subtraction_radius=15,
    particle_radius=5,
)
Docstring: Apply background removal and denoising
File:      c:\users\marcelo_researcher\appdata\local\temp\ipykernel_12848\314588285.py
Type:      function
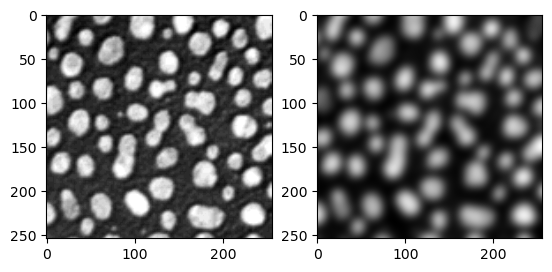
Let’s test this function with the blobs image.
image = imread("../../data/blobs.tif")
denoised_image = preprocess_image(image)

fig, ax = plt.subplots(1,2)
ax[0].imshow(image, cmap = 'gray')
ax[1].imshow(denoised_image, cmap = 'gray')
<matplotlib.image.AxesImage at 0x16f0773cc40>
In principle, the image argument can be of any type, just like any variable in Python. We have hints that the second and third arguments (background_subtraction_radius and particle_radius) should be integers because they have integer initial values. Still, if we want to build a GUI from that, we would have to design a proper widget to each of these variables ourselves.
However, since Python 3, annotations can be provided to indicate the expected variable type. This can be used by developers to build other functionalities on top of these functions.
Below, we show the same function, with annotations.
def preprocess_image2(image: ImageData, background_subtraction_radius: int = 15, particle_radius: int = 5) -> ImageData:
    """Apply background removal and denoising"""
    from skimage.morphology import white_tophat, disk
    from skimage.filters import gaussian

    footprint = disk(background_subtraction_radius)
    background_subtracted = white_tophat(image, footprint=footprint)
    denoised = gaussian(background_subtracted, sigma=particle_radius)
    return denoised
We put annotations to input arguments with the : character followed by the variable type. In this case, we add the custom napari type ImageData to the input argument image and int types to the other input arguments.
We put annotations to the outputs with the -> characters followed by the variable type, which in this case is again a napari ImageData type.
Notice that due to the fact that ImageData is a custom type from napari, we also had to import it in the beginning of this notebook.
Let’s test this “new” function with the blobs image.
denoised_image = preprocess_image2(image)

fig, ax = plt.subplots(1,2)
ax[0].imshow(image, cmap = 'gray')
ax[1].imshow(denoised_image, cmap = 'gray')
<matplotlib.image.AxesImage at 0x16f077e6a30>

There is no change in functionality, we get the same result as before!
Let’s visualize these images to napari.
viewer = napari.Viewer() # Open napari Viewer
viewer.add_image(image, name = 'blobs') # Add blobs image to napari as an image layer
viewer.add_image(denoised_image, name = 'denoised from function') # Add denoised image to napari as an image layer
viewer.grid.enabled = True # Activate grid mode by code
nbscreenshot(viewer) # Make a screenshot of the viewer

Building a GUI with magicgui#
Now, here it comes… the one-liner: 🥁🥁
preprocess_image2_widget = magicgui(preprocess_image2)
Done! GUI was created and stored in preprocess_image2_widget. We could do that because we have a properly annotated function and we provide the function itself as argument to magicgui.
We check that this new variable yields a GUI below. The type of the widget, whether it is a ComboBox or a SpinBox depends on the annotations we provided. If you are curious, check default options here.
preprocess_image2_widget
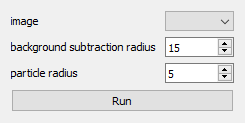
The output above is a static image of the interface. But the object that we created is an interactive one. We can add this GUI to napari with the following command.
viewer.window.add_dock_widget(preprocess_image2_widget)
<napari._qt.widgets.qt_viewer_dock_widget.QtViewerDockWidget at 0x16f08ef4790>
Now go to napari and click on the “Run” button.
nbscreenshot(viewer)

Another way of running the widget if by calling the widget like this:
denoised_from_widget = preprocess_image2_widget()
nbscreenshot(viewer)
We got the same result. This is awesome! We can now call the same function either from code or from a napari widget!
Exercise 1#
Consider the function below. Annotate the function to make it receive a ImageData type as input and to return a LabelsData type as output.
Then, create a widget from this annotated function with magicgui and add it to napari. Finally, run it via code or from napari.
from napari.types import ImageData, LabelsData
def segment_image(image):
    """Apply thresholding and connected component analysis"""
    from skimage.filters import threshold_otsu
    from skimage.measure import label

    binary = image > threshold_otsu(image)
    labels = label(binary)
    return labels
Exercise 2#
Create your own image processing function that receives an image and a boolean variable (maybe other parameters if you like), and returns a different processed image depending if the boolean variable is True or False.
Add annotations to its arguments. Call it from code and send the output to napari.
Then, generate a widget with magicgui and add the widget to napari. Run the widget from napari. Compare your results.