Feature extraction
Contents
Feature extraction#
In this notebook, you will create an instance segmentation of biological data and extract quantitiative features from this data with the regionprops_table() function from scikit-image.
from skimage import data, filters, measure
import pandas as pd
import matplotlib.pyplot as plt
Different types of features#
As shown in the lecture, features can be grouped in a few general types. Many features tyically belong to one of the following:
Intensity-based features: These are based on the image intensity values in selected areas of interest
Shape-based features: These describe the general shape of an object and can be measured independ of the original intensity values
Spatial features: These features typically take into account not only the object itself but also its location in the image or with reference to other objects.
Working with dictionaries#
Measured features of an image are essentially tabular data, which can be handled very efficiently in Python. Tabular data for typical labelled image data looks like this:
Label |
feature 1 |
feature 2 |
|---|---|---|
1 |
some value |
some value |
2 |
some value |
some value |
3 |
some value |
some value |
… |
Remember: Labelled images with multiple occurrences of the same type of objects (e.g., cells or nuclei) are the result of an instance segmentation task, whereas a unique label is assigned to every object.
Recap: Dictionaries#
Dictionaries in Python are a handy datatype to keep track of mixed data (strings, numbers, etc). They have a key-value structure and can be created and accessed like this:
data1 = [1, 2, 3]
data2 = ['Monday', 'Tuesday', 'Wednesday']
my_dict = {'numbers': data1,
          'days': data2}
my_dict
{'numbers': [1, 2, 3], 'days': ['Monday', 'Tuesday', 'Wednesday']}
my_dict['days']
['Monday', 'Tuesday', 'Wednesday']
my_dict.keys()
dict_keys(['numbers', 'days'])
The Pandas library provides a great amount of useful functions to work with tabular data. The pandas-equivalent of a dictionary is called a DataFrame and can be created from a dictionary by simple means:
df = pd.DataFrame(my_dict)
df
| numbers | days | |
|---|---|---|
| 0 | 1 | Monday |
| 1 | 2 | Tuesday |
| 2 | 3 | Wednesday |
Accessing the data works just like with dictionaries:
df['days']
0       Monday
1      Tuesday
2    Wednesday
Name: days, dtype: object
Exercises#
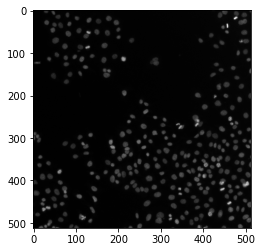
First, let’s get some sample data from scikit-image:
image = data.human_mitosis()
plt.imshow(image, cmap='gray')
<matplotlib.image.AxesImage at 0x202d039f640>
Exercise 1#
Apply Otsu-thresholding to the image to create a binary image and then create a label image from the binary image:
Exercise 2#
Use the measure.regionprops_table function to measure the area and the mean intensity for every object.
Hint: You can create a list of measurements to be passed to regionprops_table like this: properties = ['property1', 'property2', ...]. You find a list of all possible properties here.
results =
Exercise 3#
The results variable now contains the derived measurements from the input data and is of type dict.
Use the
dictionary.keys()command to print all columns in the results variable to the notebook.Remember, Python dictionaries can be accessed like this:
value = dictionary[key]. Use this this to print all area measurements fromresultsto this notebook!
Exercise 4#
When we obtain measurements from image data, we usually want to visualize them and do some statistical evaluation. You have already learned to plot histograms with matplotlib - use this to visualize the distribution of areas in the image data as a histogram!
Hint: You can retrieve the area measurements from the results as described above.
Exercise 5#
Lastly, calculate a mean and standard deviation of the areas of all objects in the image. In order to do so, you need to
retrieve the measurements from the
resultsdataframe as described aboveConvert it to a numpy array with np.asarray()
Calculate and print the mean and the standard deviation from the results
Hint: Numpy arrays have some convenience functions attached to them (e.g., some_array.function()) attached to them - see if you can find out the functions for the mean and standard deviation!