Multi-channel image data
Contents
Multi-channel image data#
Beyond two dimensional images which can be expressed as 2-D matrix, also higher dimensional, multi-channel images are quite common.
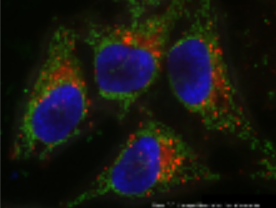
Let’s open the hela-cells image from Fiji. Here is a thumbnail image for us to compare later:
We open the image with imread and display it with imshow:
from skimage.io import imread, imshow
image = imread('../../data/hela-cells.tif')

imshow(image)
C:\Miniconda\envs\devbio-napari-env2\lib\site-packages\skimage\io\_plugins\matplotlib_plugin.py:150: UserWarning: Low image data range; displaying image with stretched contrast.
  lo, hi, cmap = _get_display_range(image)
Clipping input data to the valid range for imshow with RGB data ([0..1] for floats or [0..255] for integers).
<matplotlib.image.AxesImage at 0x199c35ba9d0>
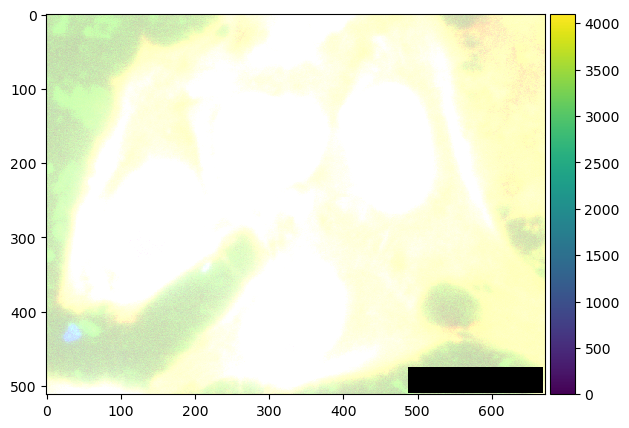
This visualization is not perfect as discussed here.
To understand what we see, we should take a look at the image’s shape. The image is obviously 672 pixels wide, 512 pixels high and has 3 channels:
image.shape
(512, 672, 3)
Because it has 3 channels, many functions may interpret these images as being RGB and try to display multi-channel images as such.
However, with image processing, we usually want to have the channels separated.
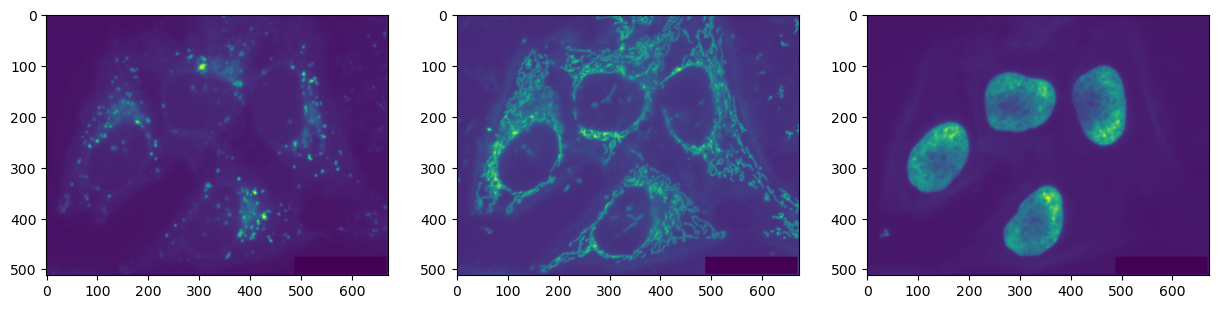
We can visualize these three channels independently by cropping them out. Furthermore, we can arrange multiple images side-by-side using matplotlib subplots:
channel1 = image[:,:,0]
channel2 = image[:,:,1]
channel3 = image[:,:,2]

import matplotlib.pyplot as plt

fig, axs = plt.subplots(1, 3, figsize=(15,15))

axs[0].imshow(channel1)
axs[1].imshow(channel2)
axs[2].imshow(channel3)
<matplotlib.image.AxesImage at 0x199c36dcb80>
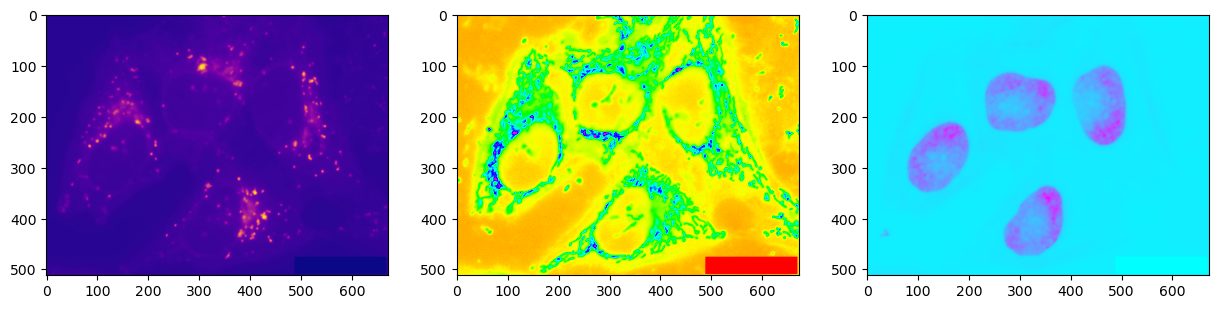
Furthermore, imshow from matplotlib also takes lookup tables / color maps as parameter. See all color maps supported by matplotlib.
fig, axs = plt.subplots(1, 3, figsize=(15,15))

axs[0].imshow(channel1, cmap='plasma')
axs[1].imshow(channel2, cmap='hsv')
axs[2].imshow(channel3, cmap='cool')
<matplotlib.image.AxesImage at 0x199c3a03e20>
Exercise#
Explore look-up tables, a.k.a. colormaps in matplotlib and visualize the three channels above as similar as possible to how the image is visualized in ImageJ.