Interactive dimensionality reduction and clustering
Contents
Interactive dimensionality reduction and clustering#
The napari-clusters-plotter offers tools to perform various dimensionality reduction algorithms and clustering methods interactively in napari.
Starting point#
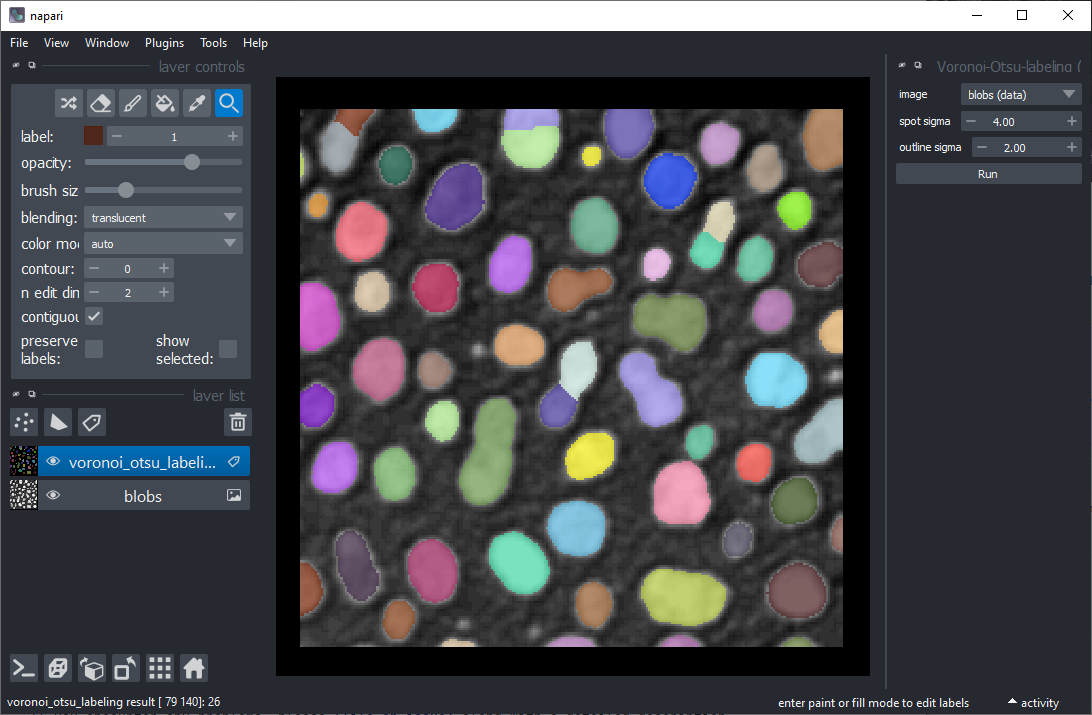
For clustering objects according to their properties, the starting point is a grey-value image and a label image
representing a segmentation of objects. For segmenting objects, you can for example use the
Voronoi-Otsu-labeling approach from the menu Tools > Segmentation / labeling.
Measurements#
The first step is deriving measurements from the labeled image and the corresponding pixels in the intensity image.
You can use the menu Tools > Measurement > Regionprops (scikit-image, nsr) for that.
Just select the intensity image, the corresponding label image and the measurements to analyse and click on Run.
A table with the measurements will open:

Afterwards, you can save and/or close the measurement table. Also, close the Measure widget.
Plotting#
Once measurements were made, these measurements were saved in the properties of the labels layer which was analysed.
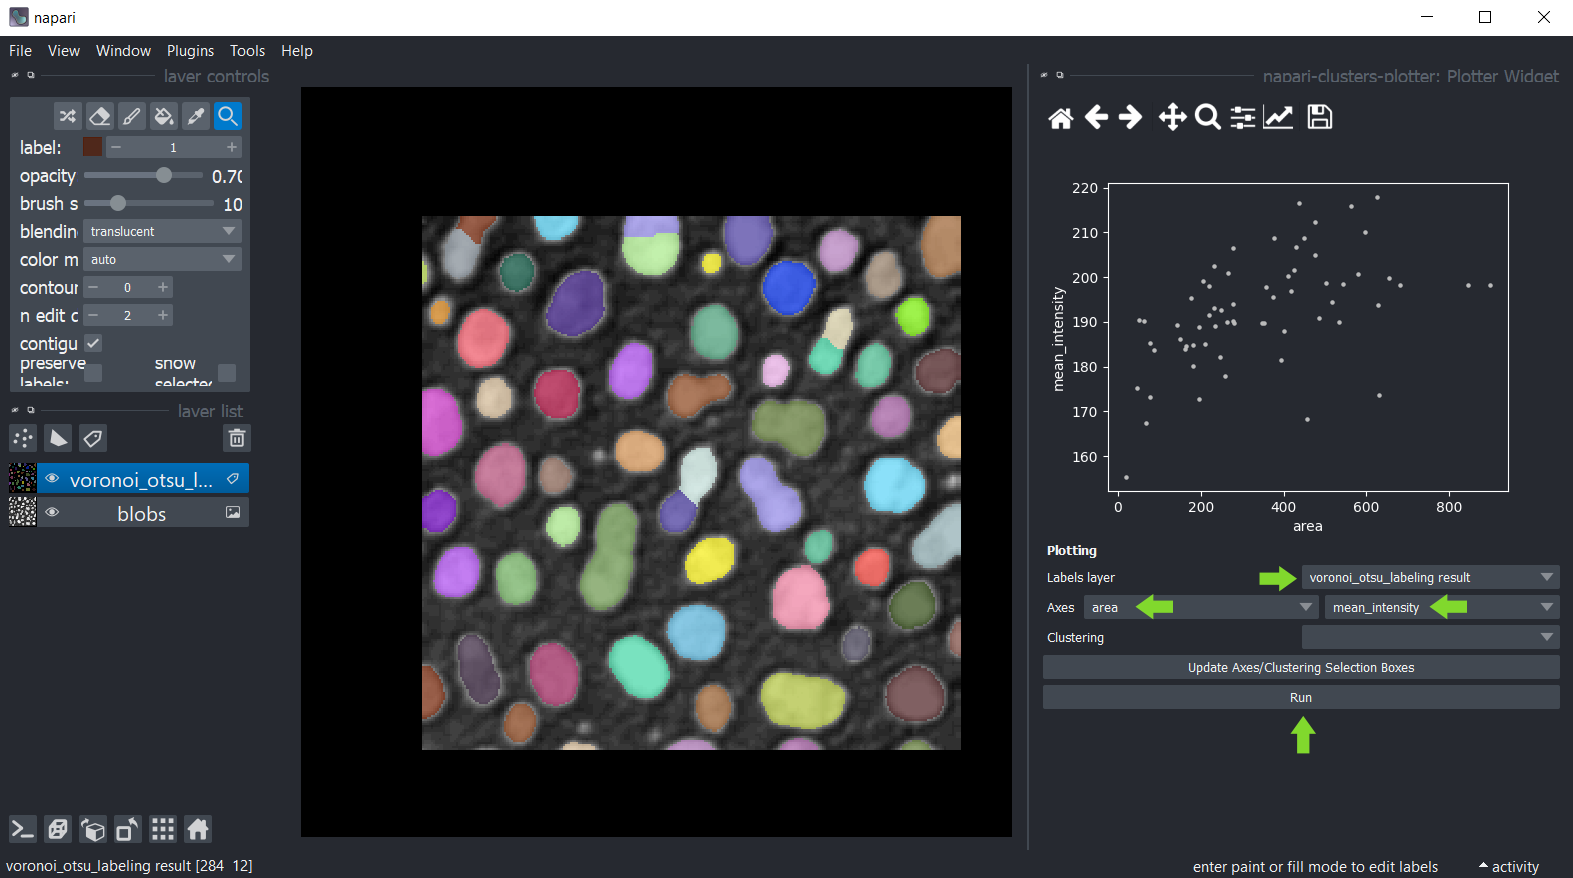
You can then plot these measurements using the menu Tools > Measurement > Plot measurements (ncp).
In this widget, you can select the labels layer which was analysed and the measurements which should be plotted
on the X- and Y-axis. If you cannot see any options in axes selection boxes, but you have performed measurements, click
on Update Axes/Clustering Selection Boxes to refresh them. Click on Run to draw the data points in the plot area.
You can also manually select a region in the plot. To use lasso tool use left mouse click, and to use a rectangle - right click. The resulting manual clustering will also be visualized in the original image. To optimize visualization in the image, turn off the visibility of the analysed labels layer.
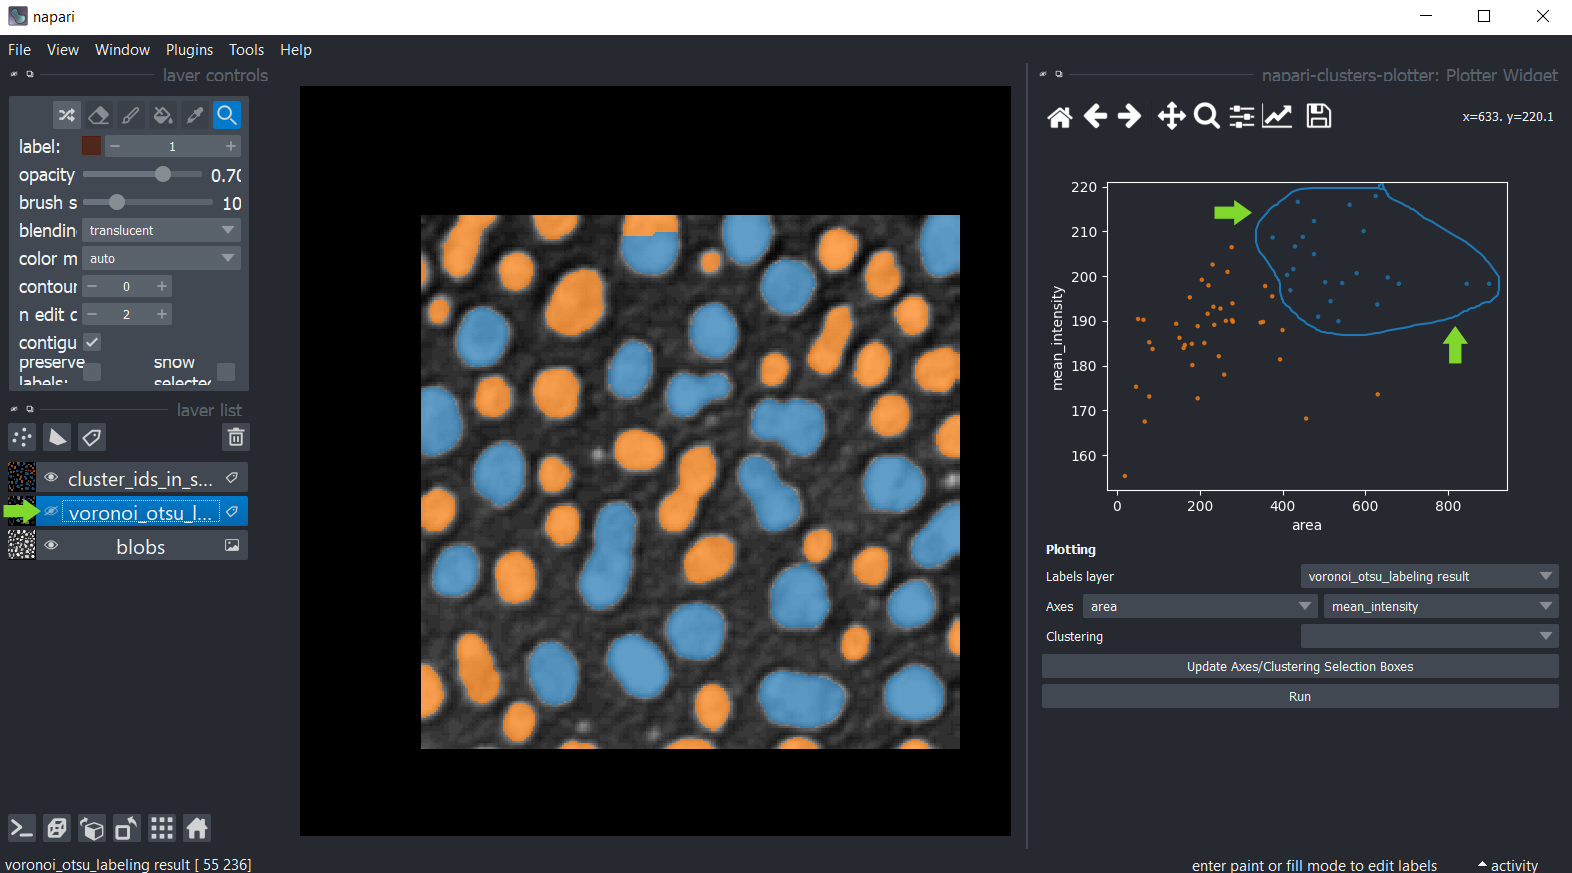
Hold down the SHIFT key while annotating regions in the plot to manually select multiple clusters.
Dimensionality reduction: UMAP, t-SNE or PCA#
For getting more insights into your data, you can reduce the dimensionality of the measurements, e.g.
using the UMAP algorithm, t-SNE
or PCA.
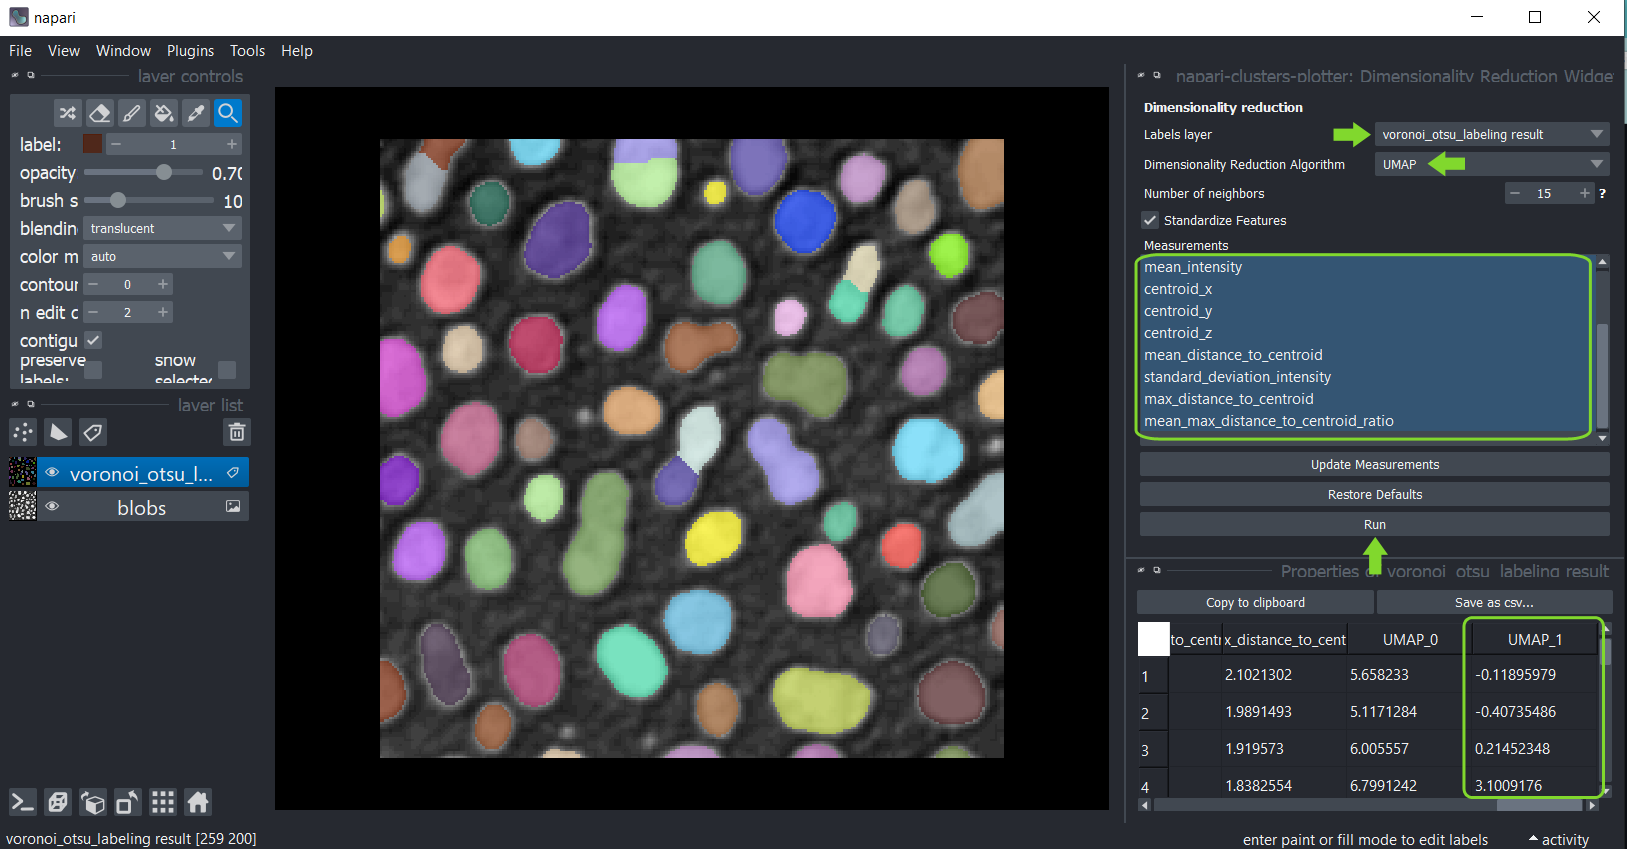
To apply it to your data use the menu Tools > Measurement > Dimensionality reduction (ncp).
Select the label image that was analysed and in the list below, select all measurements that should be
dimensionality reduced. By default, all measurements are selected in the box. If you cannot see any measurements, but
you have performed them, click on Update Measurements to refresh the box. You can read more about parameters of both
algorithms by hovering over question marks or by clicking on them. When you are done with the selection, click on Run
and after a moment, the table of measurements will re-appear with two additional columns representing the reduced
dimensions of the dataset. These columns are automatically saved in the properties of the labels layer.
Afterwards, you can again save and/or close the table. Also, close the Dimensionality Reduction widget.
Clustering#
If manual clustering, as shown above, is not an option, you can automatically cluster your data, using these implemented algorithms:
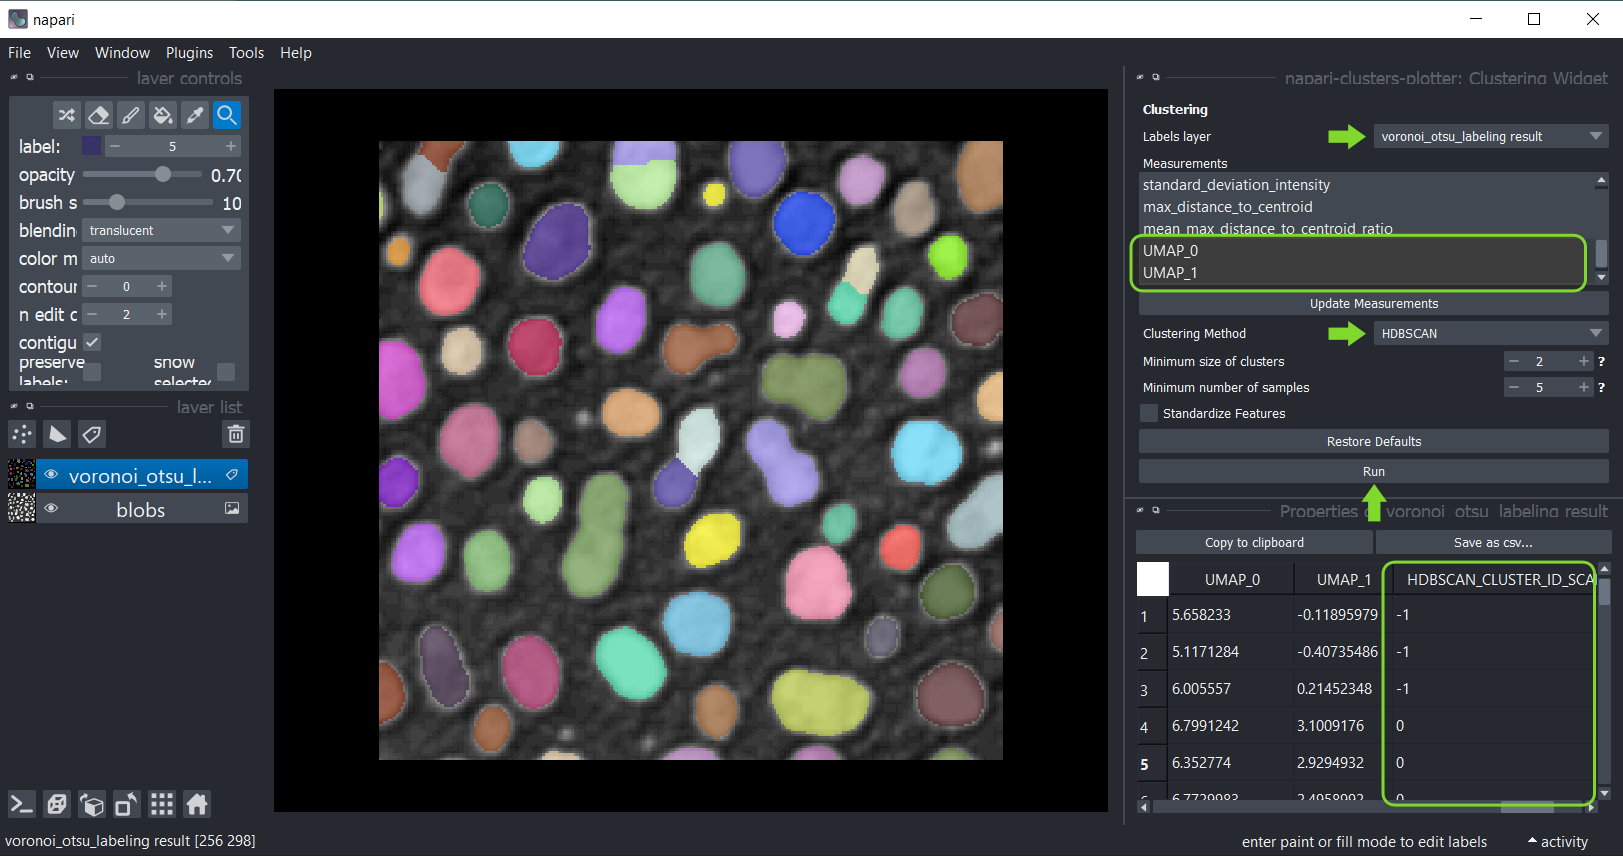
Therefore, click the menu Tools > Measurement > Clustering (ncp) and select the analysed labels layer.
This time select the measurements for clustering, e.g. select only the UMAP measurements.
Select the clustering method KMeans and click on Run.
The table of measurements will reappear with an additional column KMeans_CLUSTERING_ID containing the cluster
ID of each datapoint.
Afterwards, you can again save and/or close the table. Also, close the clustering widget.
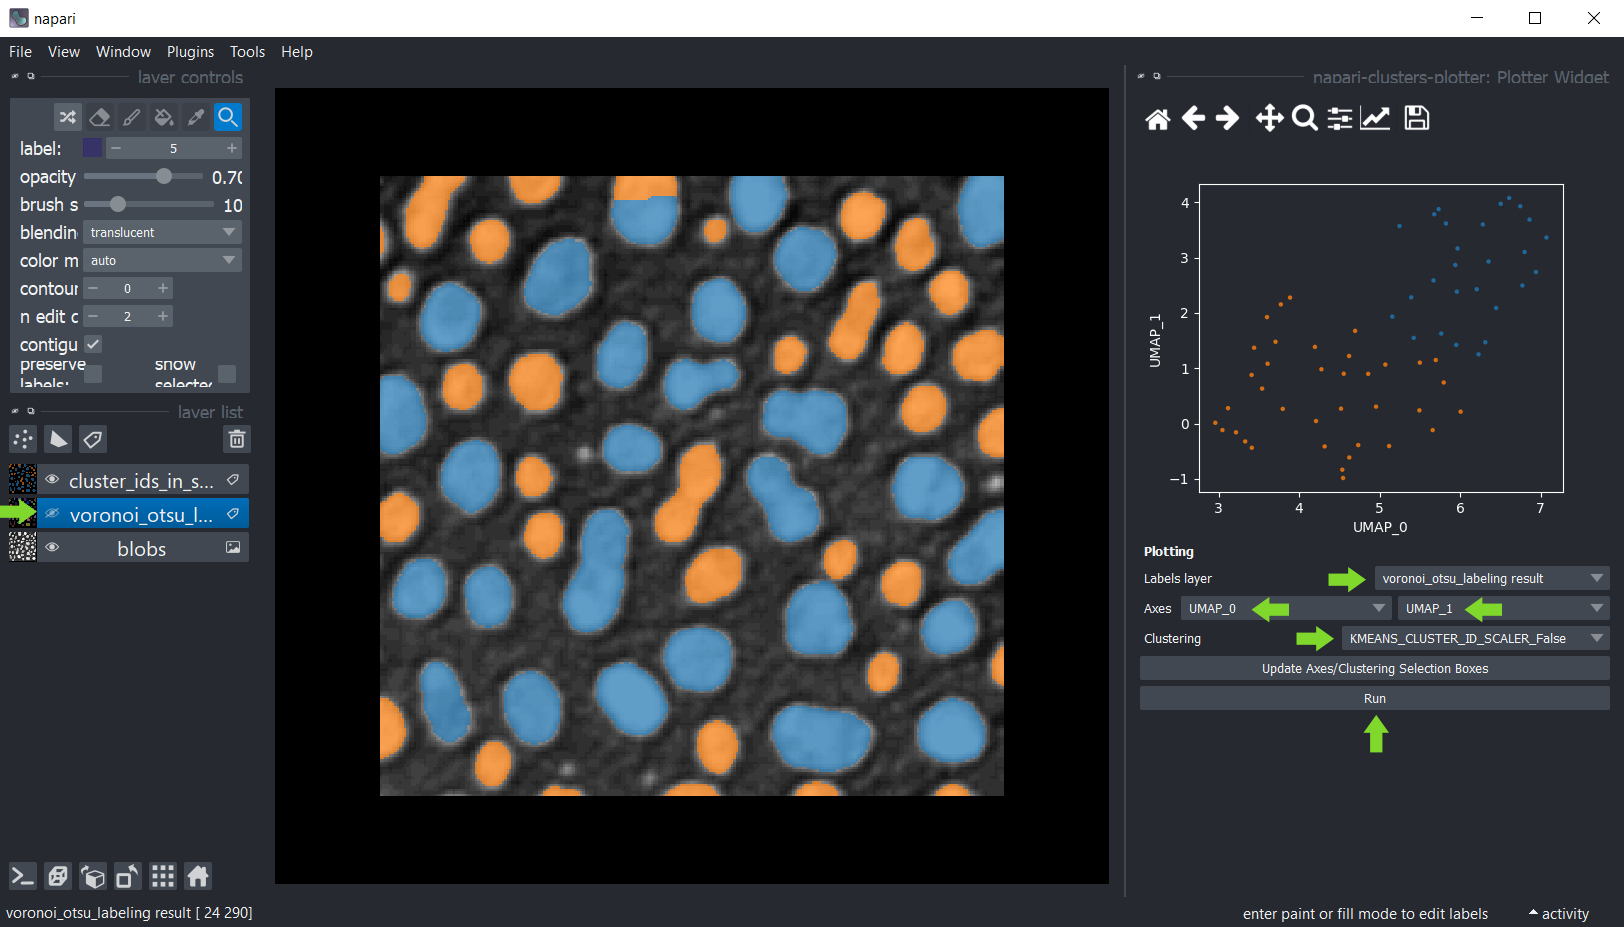
Plotting clustering results#
Return to the Plotter widget using the menu Tools > Measurement > Plot measurements (ncp).
Select UMAP_0 and UMAP_1 as X- and Y-axis and the KMeans_CLUSTERING_ID as Clustering, and click on Run.