HDBSCAN
Contents
HDBSCAN#
HDBSCAN allows to perform clustering of data points according to local neighborhood relations that are then weighted with distances between points. This allows to identify scarce points as noise and to assign cluster membership probabilities to each point.
import numpy as np
import matplotlib.pyplot as plt
import hdbscan
from sklearn.datasets import make_blobs, make_moons
n_samples=300
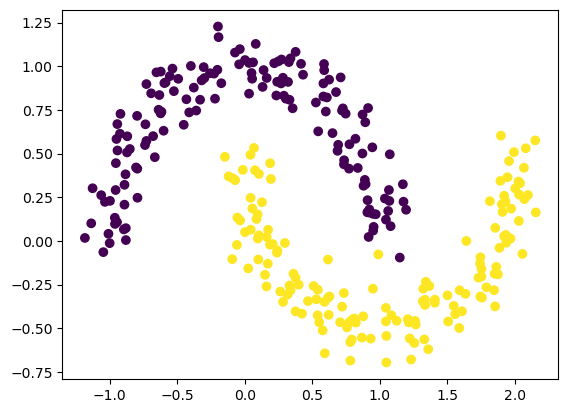
noisy_moons, y = make_moons(n_samples=n_samples, noise=0.1)
Plot the synthetic data first:
fig, ax = plt.subplots()
ax.scatter(noisy_moons[:, 0], noisy_moons[:,1], c=y)
Minimum cluster size#
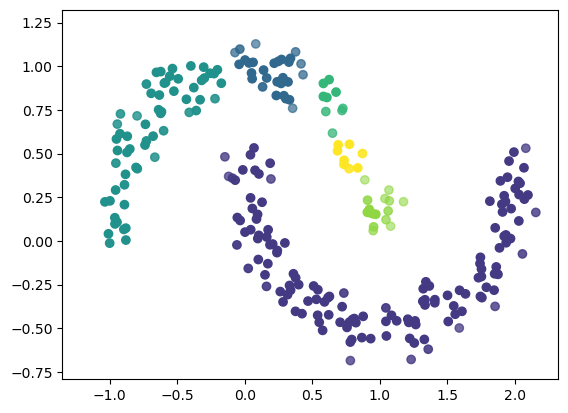
The minimum cluster size is a key parameter for hdbscan. It determines how small a cluster is allowed to be in order to be considered as a separate cluster. See the results of applying hdbscan with the default setting:
clusterer = hdbscan.HDBSCAN()
clusterer.fit(noisy_moons)
HDBSCAN()In a Jupyter environment, please rerun this cell to show the HTML representation or trust the notebook.
On GitHub, the HTML representation is unable to render, please try loading this page with nbviewer.org.
HDBSCAN()
Plot the prediction results.
Note: We use the predicted labels (clusterer.labels_) to indicate each points’s color and the cluster membership probabilities (clusterer.probabilities_) to indicate each point’s transparency in the plot. The latter can be passed to the scatter plot through the alpha keyword argument:
fig, ax = plt.subplots()
ax.scatter(noisy_moons[:, 0], noisy_moons[:,1], c=clusterer.labels_, alpha=clusterer.probabilities_)
Exercise:#
Adjust the min_cluster_size parameter so that that the clustering delivers the expected results for the above dataset:
clusterer = hdbscan.HDBSCAN(min_cluster_size=)
clusterer.fit(noisy_moons)
HDBSCAN(min_cluster_size=20)In a Jupyter environment, please rerun this cell to show the HTML representation or trust the notebook.
On GitHub, the HTML representation is unable to render, please try loading this page with nbviewer.org.
HDBSCAN(min_cluster_size=20)