Voronoi tesselation
Voronoi-tesselation is the process of subdividing an area accoding to a Voronoi-diagram. In bio-imaging this method can be used to estimate where cells touch each other in case imaging data does not allwo this, e.g. if no membrane marker was used.
To demonstrate tesselation, we first load an image showing some objects.

|
cle._ image
| shape | (254, 256) |
| dtype | float32 |
| size | 254.0 kB |
| min | 8.0 | | max | 248.0 |

|
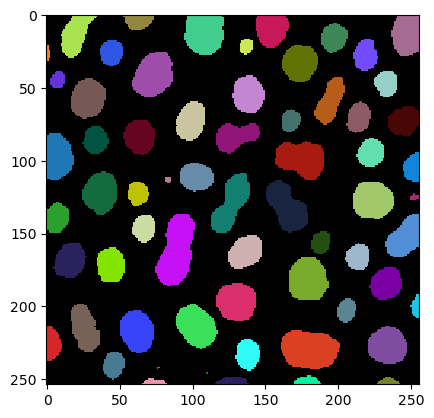
We also segment the nuclei in this image and label them.

|
cle._ image
| shape | (254, 256) |
| dtype | uint32 |
| size | 254.0 kB |
| min | 0.0 | | max | 64.0 |
|
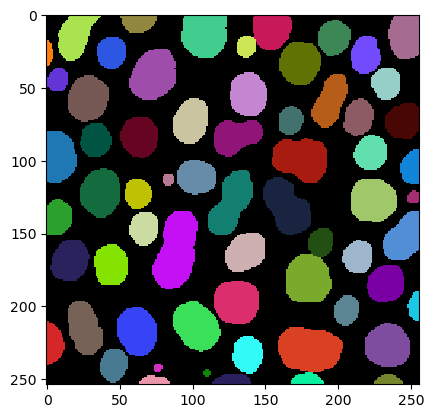
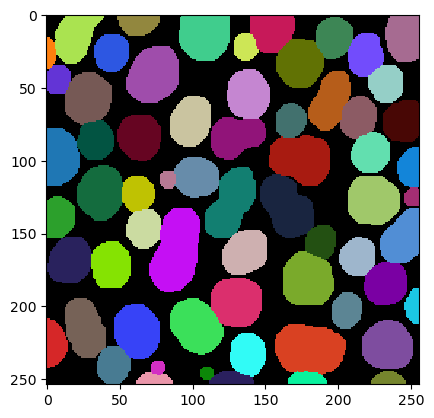
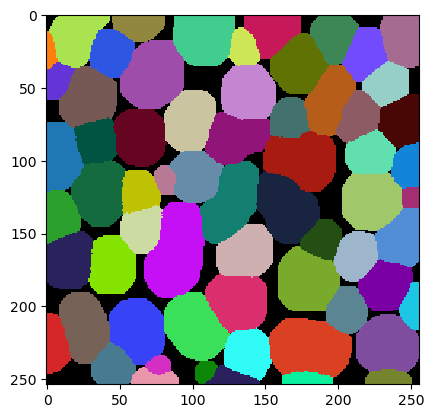
By dilating the labels, we fill up the space between them. We could do this in a loop:
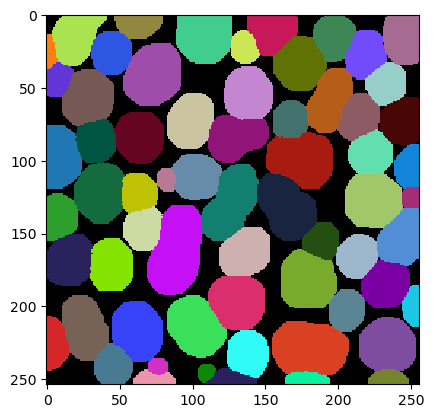
We can also do this with a single function call and fill up background intensity until its gone. This process is called Voronoi-Tesselation. The result is a Voronoi-label-image. You can also see it as a discrete Voronoi-diagram.

|
cle._ image
| shape | (254, 256) |
| dtype | uint32 |
| size | 254.0 kB |
| min | 1.0 | | max | 64.0 |
|
An common alternative visualization is the corresponding label-edge-image.

|
cle._ image
| shape | (254, 256) |
| dtype | uint8 |
| size | 63.5 kB |
| min | 0.0 | | max | 1.0 |

|
Voronoi and Delauney diagrams
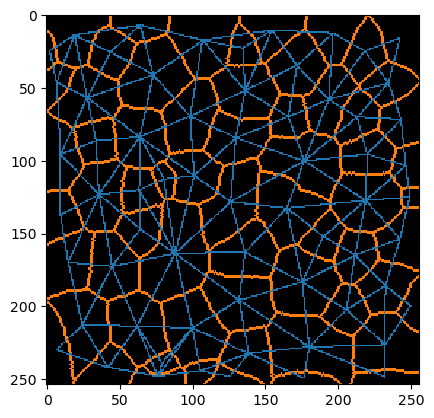
There is a close relationship with the Delauney triangulation. Voronoi and Delauney diagrams are dual graphs. In the continuous case, you can compute the one from the other and vice-versa. In the discrete case, one can determine an estimation of the Delauney graph from a Voronoi-label-image by determining the label’s centroids and connecting them:

|
cle._ image
| shape | (254, 256) |
| dtype | float32 |
| size | 254.0 kB |
| min | 0.0 | | max | 1.0 |
|
By visualizing the label-edge-image and neighbor-mesh in the same image, their relationship becomes more obvious.
Exercise
Visualize the neighbor-mesh and the label-edges of this label_image together as shown above:

|
cle._ image
| shape | (100, 200) |
| dtype | uint32 |
| size | 78.1 kB |
| min | 1.0 | | max | 60.0 |
|