Exercise: Thresholding
Contents
Exercise: Thresholding#
In this exercise, we will try out different threshold methods and see how they perform on the same data and create a label image from the binarized image data.
Recap#
Segmentation is the process of separating single pixels into different categories that may or may not have specific meaning attached to that. Thresholding is a simple, yet often effecte segmentation technique. In thresholding, pixels are separated into two categories - the background and the foreground of an image - by comparing the intensities of each image to a single value, the threshold value. Finding a “good” threshold value is therefore of key importance.
The output of a thresholding operation is a binary image, consiting of 0s and 1s - which is equivalent to True and False in terms of boolean values.
Vocabulary: Thresholding is a type of segmentation. Separating the image into two types of pixels (background and foreground) is a type of semantic segmentation, and is - since only two types of pixels exist in the output - referred to as a binarization operation.
How to code: Remember - in Python you can compare objects (single numbers or images) to threshold values simply by using the < or > operator - make sure to put the output into a new variable!
from skimage import data, filters, measure
import matplotlib.pyplot as plt
import napari
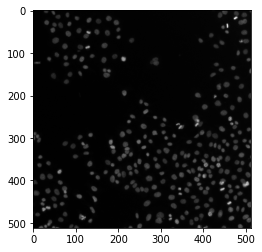
image = data.human_mitosis()
plt.imshow(image, cmap='gray')
<matplotlib.image.AxesImage at 0x232307465e0>
Now, apply several of the thresholds from skimage to the image data! Choose one that you think is suitable.
Hint: You can find them under filters.threshold_... - use the tab key or the documentation to find out how to use the implemented threshold functions.
binary_image = # code goes here
Again, use plt.imshow() to visualize the results
# Code goes here
Now we would like to perform connected-component analysis. Use the appropriate function from skimage (measure.label()) for this task!
label_image = # code goes here
Visualization in Napari#
viewer = napari.Viewer()
WARNING: DirectWrite: CreateFontFaceFromHDC() failed (Indicates an error in an input file such as a font file.) for QFontDef(Family="8514oem", pointsize=12, pixelsize=20, styleHint=5, weight=50, stretch=100, hintingPreference=0) LOGFONT("8514oem", lfWidth=0, lfHeight=-20) dpi=240
Use the add_image() and the add_labels() function to add image, binary_image and label_image to the viewer and create screenshot of the viewer with the napari.utils.nbscreenshot() function.
# Code goes here