K-means clustering
Contents
K-means clustering#
This notebook demonstrates scikit-learn’s k-means clustering on synthetic data as well as the key-parameters and limitations for k-means clustering.
import numpy as np
import matplotlib.pyplot as plt

from sklearn import cluster
from sklearn.datasets import make_blobs, make_moons
import os
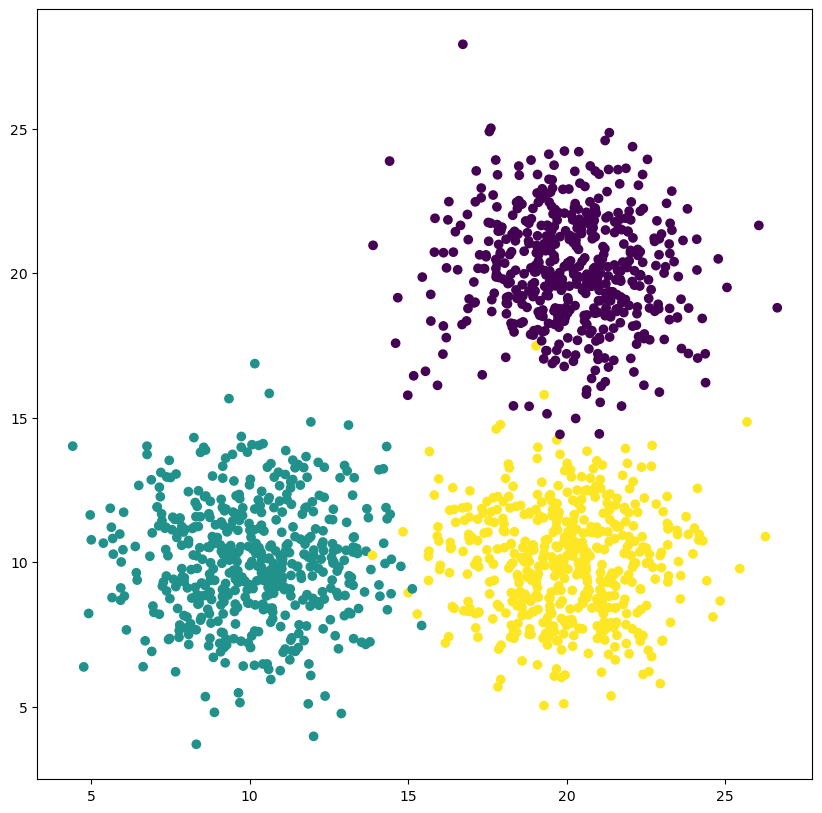
First, generate some random, synthetic data. scikit-learn provides the datasets module for this:
n_samples = 1500
random_state = 1
X, y = make_blobs(n_samples=n_samples, random_state=1,  cluster_std=2, centers = [[20,20], [10,10], [20,10]])
fig, ax = plt.subplots(figsize=(10, 10))
ax.scatter(X[:, 0], X[:, 1], c = y)
<matplotlib.collections.PathCollection at 0x27204196eb0>
In order to classify every point in this image, we’ll create an image large enough to cover all points in the above figure. We then retrieve all the pixel coordinates of the image
image = np.zeros((30, 30))
coords = np.argwhere(image==0)[:, ::-1]
Try to understand the following for-loop: What happens in every iteration?
for i in range(1, 15, 1):
    clusterer = cluster.KMeans(n_clusters=3, random_state=1, max_iter=i, n_init=1, init='random')
    y_pred = clusterer.fit_predict(X)

    LUT = np.array([1,0,2])  # permutate predicted labels
    y_pred_background = clusterer.predict(coords)

    fig, ax = plt.subplots()
    handle=ax.imshow(y_pred_background.reshape(30,-1))
    ax.scatter(X[:, 0], X[:, 1], c=y_pred, edgecolor='black')
    ax.scatter(clusterer.cluster_centers_[:,0], clusterer.cluster_centers_[:,1], color='white', marker='x', s=200, label='Cluster center i')
    ax.set_title(f'Iteration #{i}')

    ax.legend()
    fig.tight_layout()
    fig.savefig(os.path.join(os.getcwd(), 'images', 'clusters' 'kmeans_process_{:02d}.png'.format(i)))
Incorrect cluster numbers#
The number of clusters is one of the key parameters for k-means clustering - it is both unknown in some situations yet crucial to the success of the clustering. Consider the following example. We can clearly see that two clusters do not accurately capture the structure in our data.
clusterer = cluster.KMeans(n_clusters=2)
y_pred = clusterer.fit_predict(X)
fig, ax = plt.subplots()
ax.scatter(X[:, 0], X[:,1], c=y_pred)
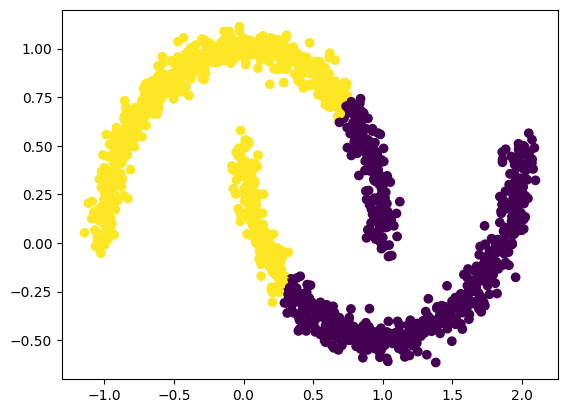
Complex cluster shapes#
Another limitation is given by the fact that assignment to a cluster is decided through the distance of a point to the center of a cluster. However, the center of a cluster may still be far away from points in the cluster!
noisy_moons, y = make_moons(n_samples=n_samples, noise=0.05)
clusterer = cluster.KMeans(n_clusters=2)
y_pred = clusterer.fit_predict(noisy_moons)
C:\Users\johamuel\Anaconda3\envs\stress\lib\site-packages\sklearn\cluster\_kmeans.py:1334: UserWarning: KMeans is known to have a memory leak on Windows with MKL, when there are less chunks than available threads. You can avoid it by setting the environment variable OMP_NUM_THREADS=6.
  warnings.warn(
fig, ax = plt.subplots()
ax.scatter(noisy_moons[:, 0], noisy_moons[:,1], c=y_pred)
fig.savefig('kmeans_on_moons.png')
Exercise 1:#
Try k-means on two more datasets out of the sklearn.datasets module and plot the clustering results.
Exercise 2:#
Try k-means on any of the notebooks from the previous part on dimensionality reduction:
MNIST numbers dataset & UMAP
Penguins dataset & UMAP
Penguins dataset & PCA