Workflow Exercise#
Use this notebook create a workflow that can compare intensity measurements of nuclei from 3 different images.
Here is a general guide:
Design a segmentation strategy for the nuclei and display the results (either with matplotlib or napari)
Extract intensity features of the segmented objects and store them in table(s)
Choose a suitable plot for the intensities and plot a graph comparing them with different colors
Run a suitable statistical test to check if we can reject the null hypothsis (there is no difference in intensities)
Add annotations containing relevant test results to the plots, if applicable
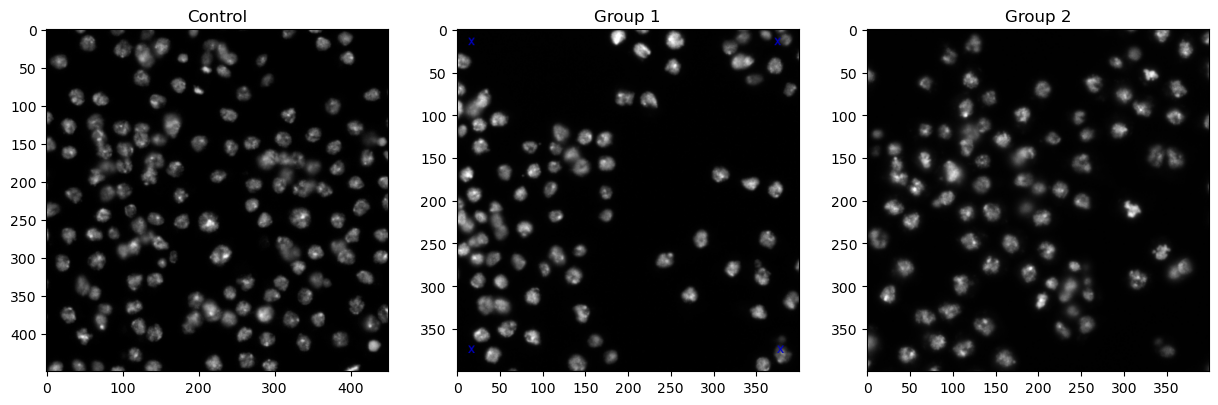
We load the images for this exercise below.
from skimage.io import imread
import matplotlib.pyplot as plt

control_image = imread('../../data/Workflow_Exercise/control.tif')
group_1_image = imread('../../data/Workflow_Exercise/group1.tif')
group_2_image = imread('../../data/Workflow_Exercise/group2.tif')
figure, axes = plt.subplots(1, 3, figsize=(15, 5))

axes[0].imshow(control_image, cmap='gray')
axes[0].set_title('Control')
axes[1].imshow(group_1_image, cmap='gray')
axes[1].set_title('Group 1')
axes[2].imshow(group_2_image, cmap='gray')
axes[2].set_title('Group 2')
Text(0.5, 1.0, 'Group 2')