Label image visualization
Contents
Label image visualization#
Depending on with which image processing library you work, label images may be visualized differently. A common way for visualizing labels is to draw objects in different colours.
See also
from skimage.io import imread, imshow
from skimage.measure import label
from skimage.color import label2rgb
Visualizing label images using scikit-image#
Per default, when using python/numpy/scikit-image, label images are shown in yellow-blue, which may make it hard to differentiate objects that are touching or surrounded by black background.
image = imread("../../data/blobs.tif")
label_image = label(image > 128)

imshow(label_image)
C:\Users\rober\miniconda3\envs\devbio-napari-env4\lib\site-packages\skimage\io\_plugins\matplotlib_plugin.py:150: UserWarning: Low image data range; displaying image with stretched contrast.
  lo, hi, cmap = _get_display_range(image)
<matplotlib.image.AxesImage at 0x277da917550>

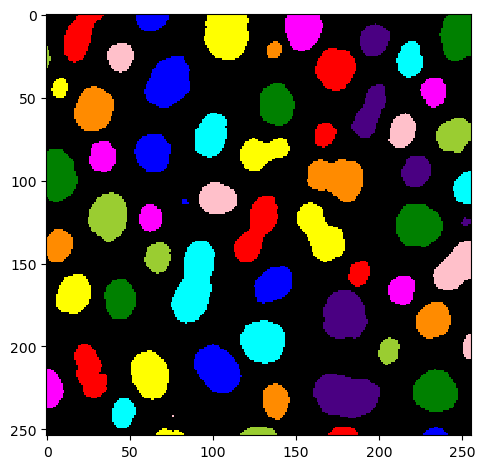
One way for improving visualization works using the label2rgb function.
Note: The resulting rgb_label_image must not be further processed. It is for visualization purposes only.
rgb_label_image = label2rgb(label_image)

imshow(rgb_label_image)
<matplotlib.image.AxesImage at 0x277da9d1640>
Visualizing label images using some other libraries#
We spent some effort to make label image visualization more straight-forward in the some napari-related image processing libraries.
import napari_segment_blobs_and_things_with_membranes as nsbatwm

label_image_2 = nsbatwm.connected_component_labeling(image > 128)
label_image_2
minmax None None

|
nsbatwm made image
|
import napari_simpleitk_image_processing as nsitk

label_image_3 = nsitk.connected_component_labeling(image > 128)
label_image_3
minmax None None
|
|
n-sitk made image
|
import pyclesperanto_prototype as cle

label_image_4 = cle.label(image > 128)
label_image_4

|
cle._ image
|