Canvas Widget#
import napari
import numpy as np
from biaplotter.plotter import CanvasWidget
from napari.utils import nbscreenshot
Adding Canvas Widget to napari#
viewer = napari.Viewer()
canvas_widget = CanvasWidget(viewer)
viewer.window.add_dock_widget(canvas_widget)
nbscreenshot(viewer)
C:\Users\mazo260d\Documents\GitHub\biaplotter\src\biaplotter\colormap.py:34: UserWarning: Categorical colormap detected. Setting categorical=True. If the colormap is continuous, set categorical=False explicitly.
  warnings.warn(
Check canvas_widget default artists and selectors
canvas_widget.artists
{'SCATTER': <biaplotter.artists.Scatter at 0x1c4463d9b90>,
 'HISTOGRAM2D': <biaplotter.artists.Histogram2D at 0x1c452413110>}
canvas_widget.selectors
{'LASSO': <biaplotter.selectors.InteractiveLassoSelector at 0x1c452476650>,
 'ELLIPSE': <biaplotter.selectors.InteractiveEllipseSelector at 0x1c45083f6d0>,
 'RECTANGLE': <biaplotter.selectors.InteractiveRectangleSelector at 0x1c4523c7b90>}
Generate some data#
def generate_gaussian_data(n_samples):
    """Generate a 2D dataset with two Gaussian clusters."""
    # Gaussian 1
    x1 = np.random.normal(loc=2, scale=1, size=n_samples//2)
    y1 = np.random.normal(loc=2, scale=1, size=n_samples//2)
    # Gaussian 2
    x2 = np.random.normal(loc=-2, scale=0.5, size=n_samples//2)
    y2 = np.random.normal(loc=-2, scale=0.5, size=n_samples//2)
    x_data = np.concatenate([x1, x2])
    y_data = np.concatenate([y1, y2])
    return np.vstack([x_data, y_data]).T
n_samples = 1000
data = generate_gaussian_data(n_samples)
Histogram2D artist is the default active artist.
canvas_widget.active_artist
<biaplotter.artists.Histogram2D at 0x1c452413110>
Adding data to the canvas#
Adding data to artist will update the histogram.
canvas_widget.active_artist.data = data
nbscreenshot(viewer)
Similarly, changing the active artist to SCATTER and adding data to it will update the scatter plot.
canvas_widget.active_artist = 'SCATTER'
canvas_widget.active_artist.data = data
nbscreenshot(viewer)
To go back to the histogram, change the active artist to HISTOGRAM2D.
canvas_widget.active_artist = 'HISTOGRAM2D'
Manually selecting data#
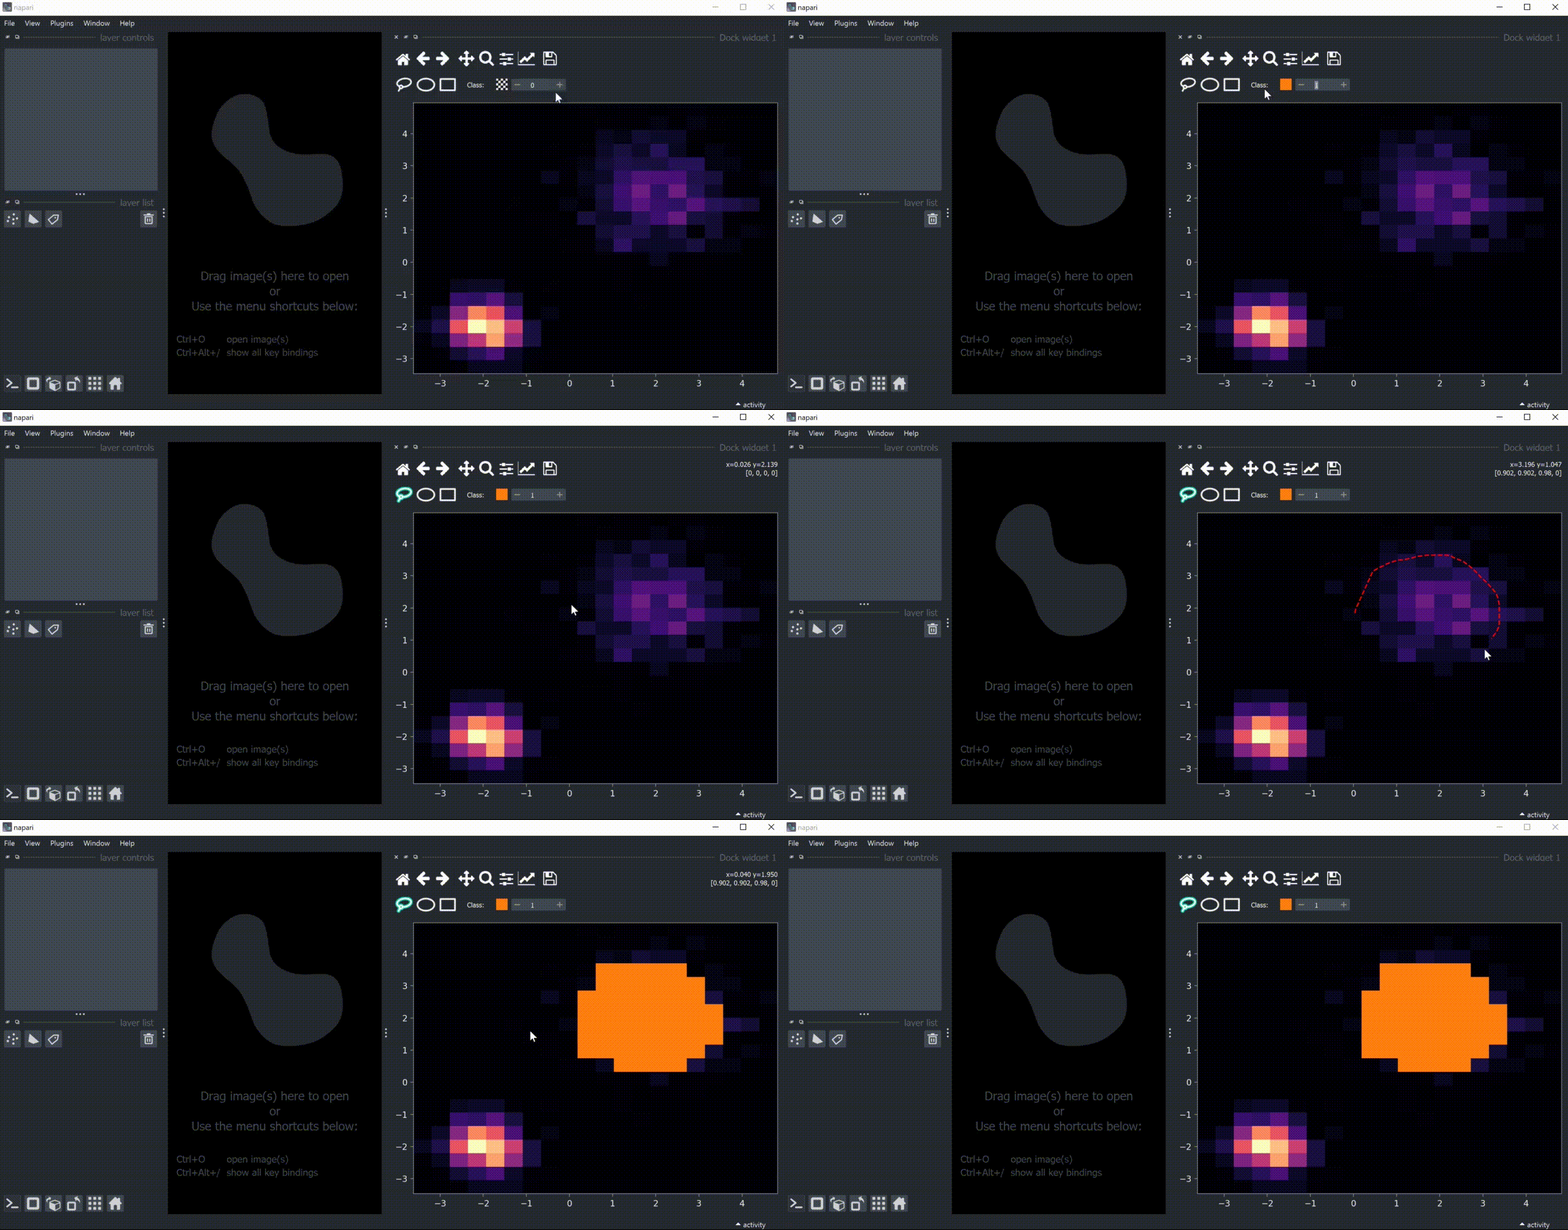
Lasso Selector#
Selecting data using lasso selector will update the active artist plot.

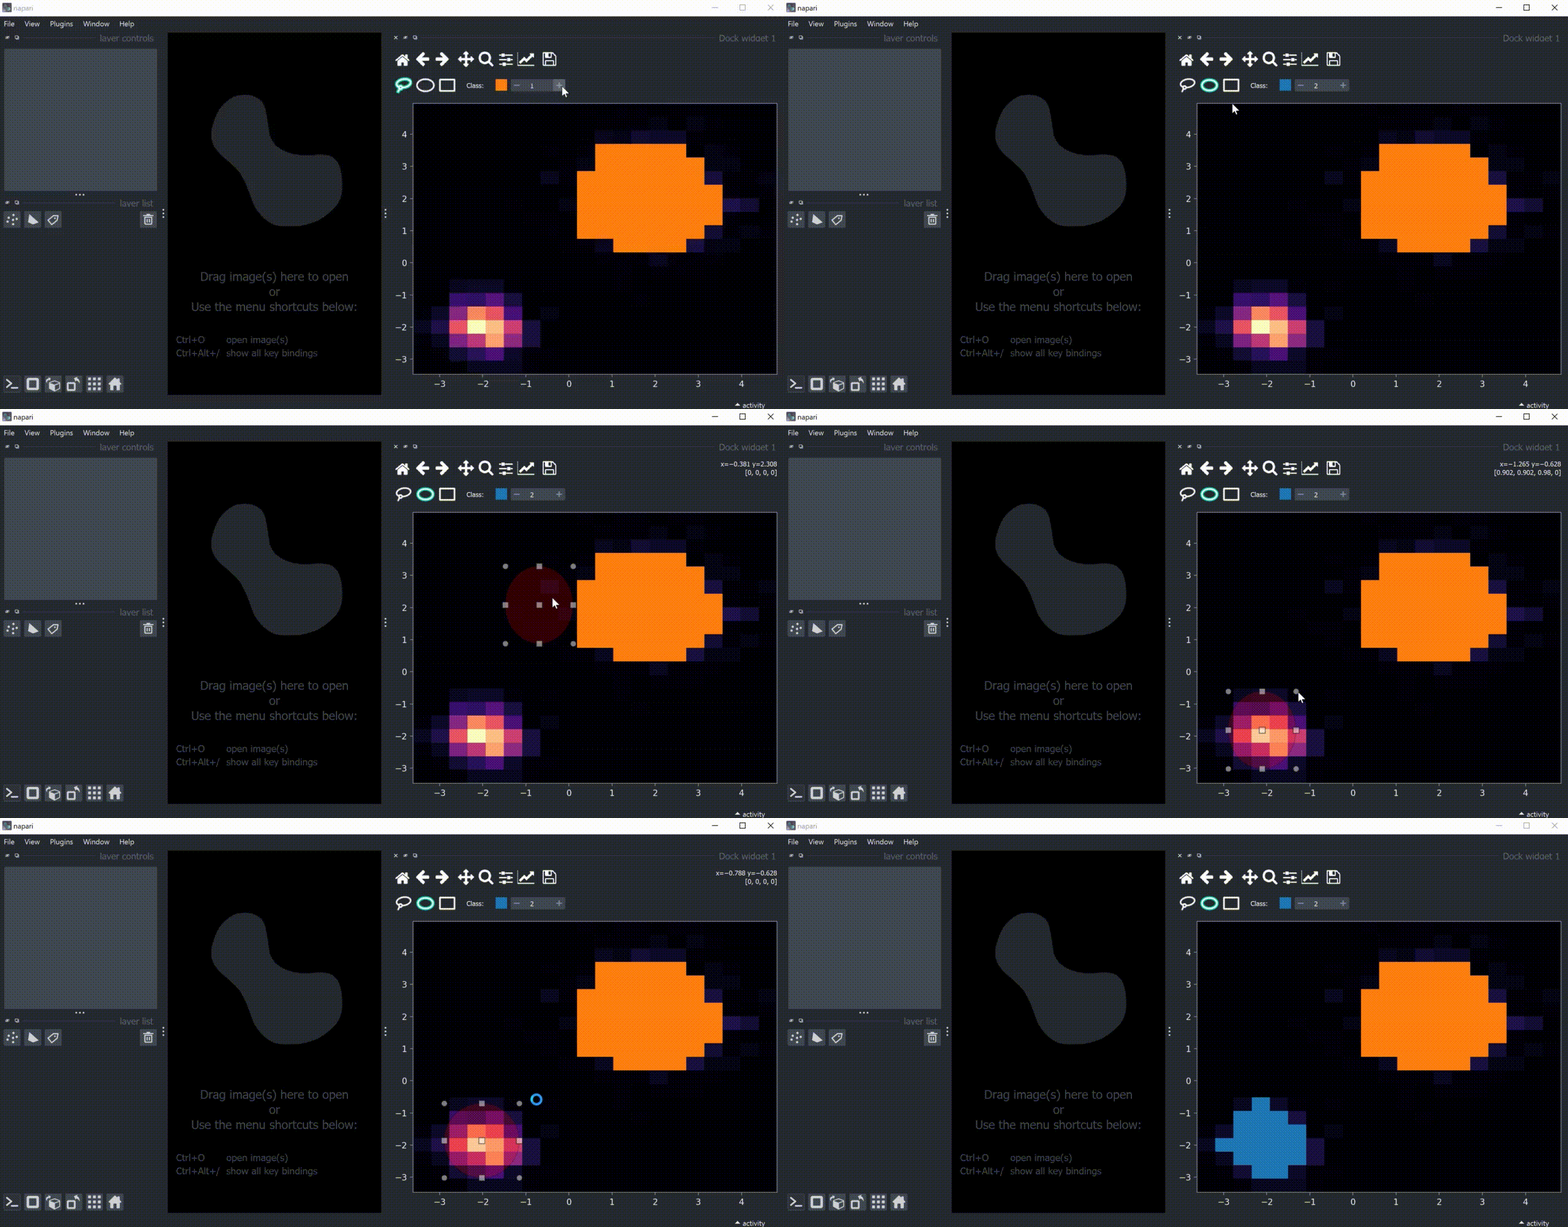
Ellipse Selector#
Ellipse selector produces an interactive ellipse that can be dragged and expanded before being applied.
Right-clicking applies the current class to the selected data.

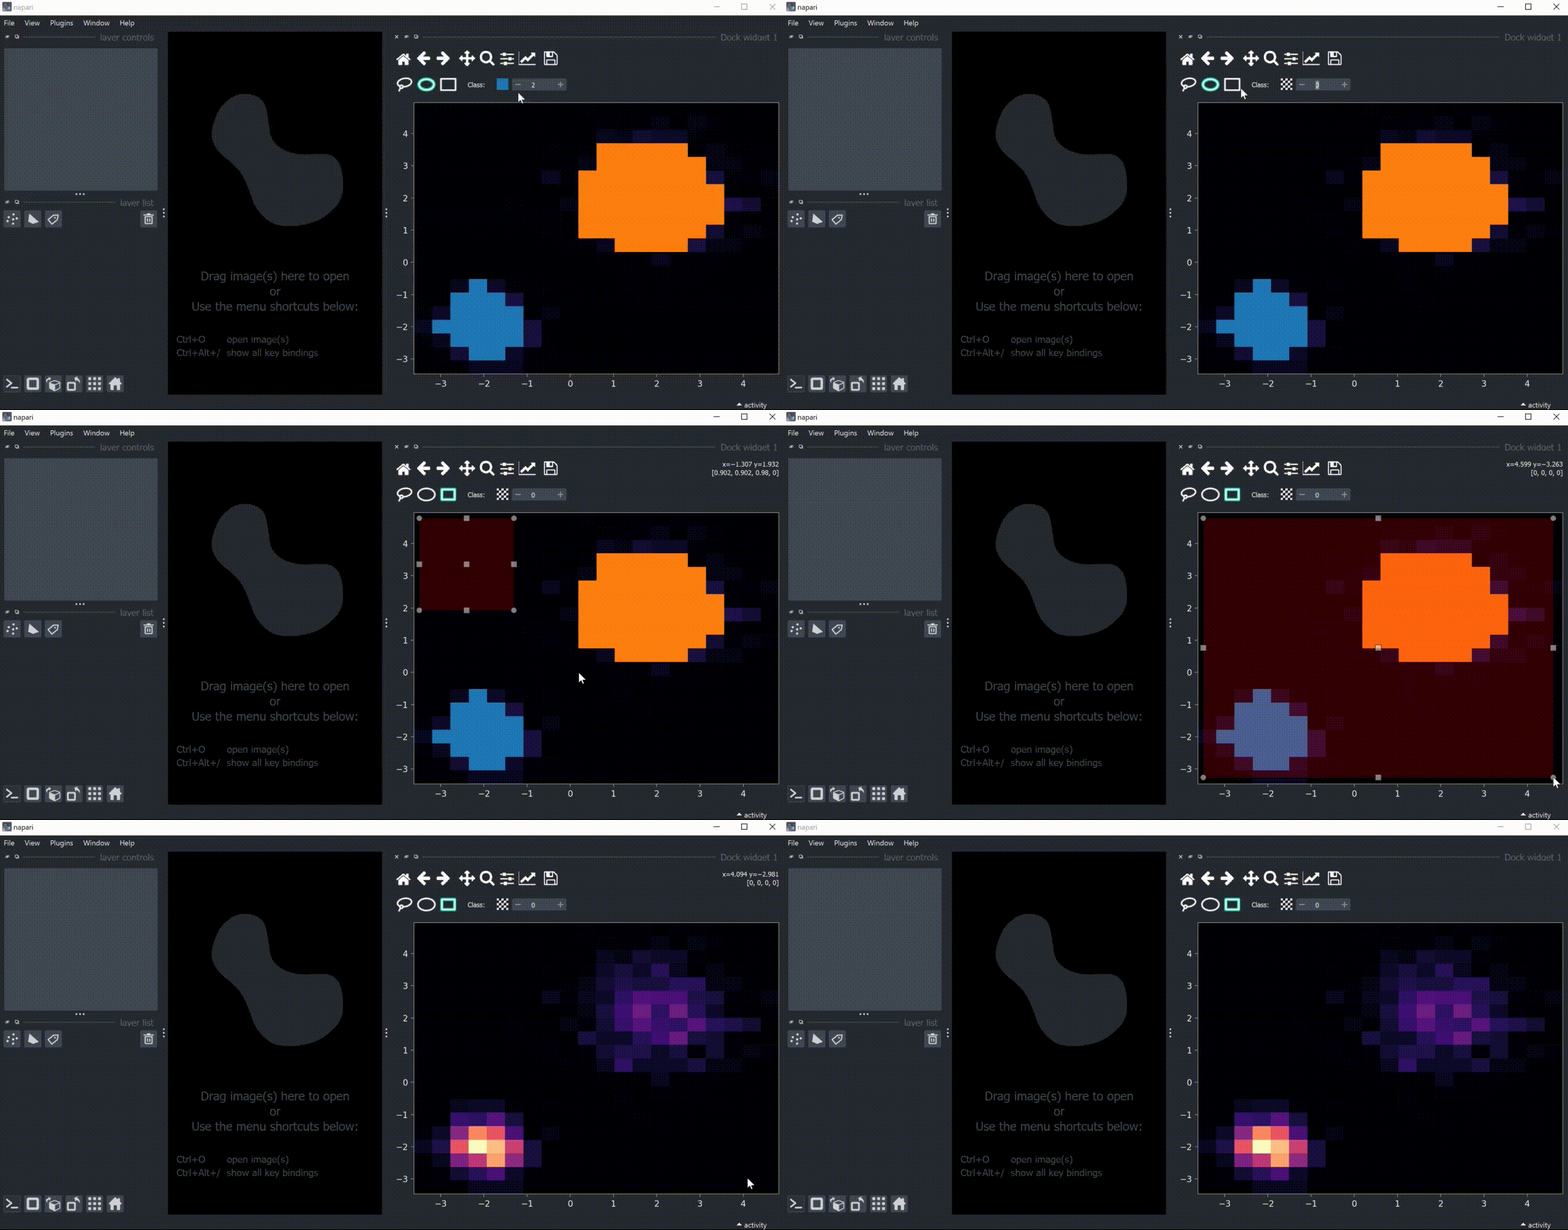
Rectangle Selector#
Rectangle selector produces an interactive rectangle that can be dragged and expanded as well.
One way to clear previuos selections is to apply class 0 to the selected data.

