Multichannel Analysis in Napari#
In this exercise we will perfom Feature Extraction and relate features to objects in different channels in napari. We will use the napari plugin napari-skimage-regionprops.
Getting started#
Open a terminal window and activate your conda environment:
mamba activate napari25
Afterwards, start up Napari:
napari
Open the following images in napari, which can be found in the data/multichannel folder of this repository (here):
actin.tif (cells)
dna.tif
cell_labels.tif
dna_labels.tif
Change the blending mode of the actin and dna layers to additive and adjust the colormap of the actin layer to green and the dna layer to magenta.
We will start by extracting features of the dna_labels objects in respect to the cell_labels objects (reference). To do that, click on Tools -> Measurement tables -> Object Features/Properties
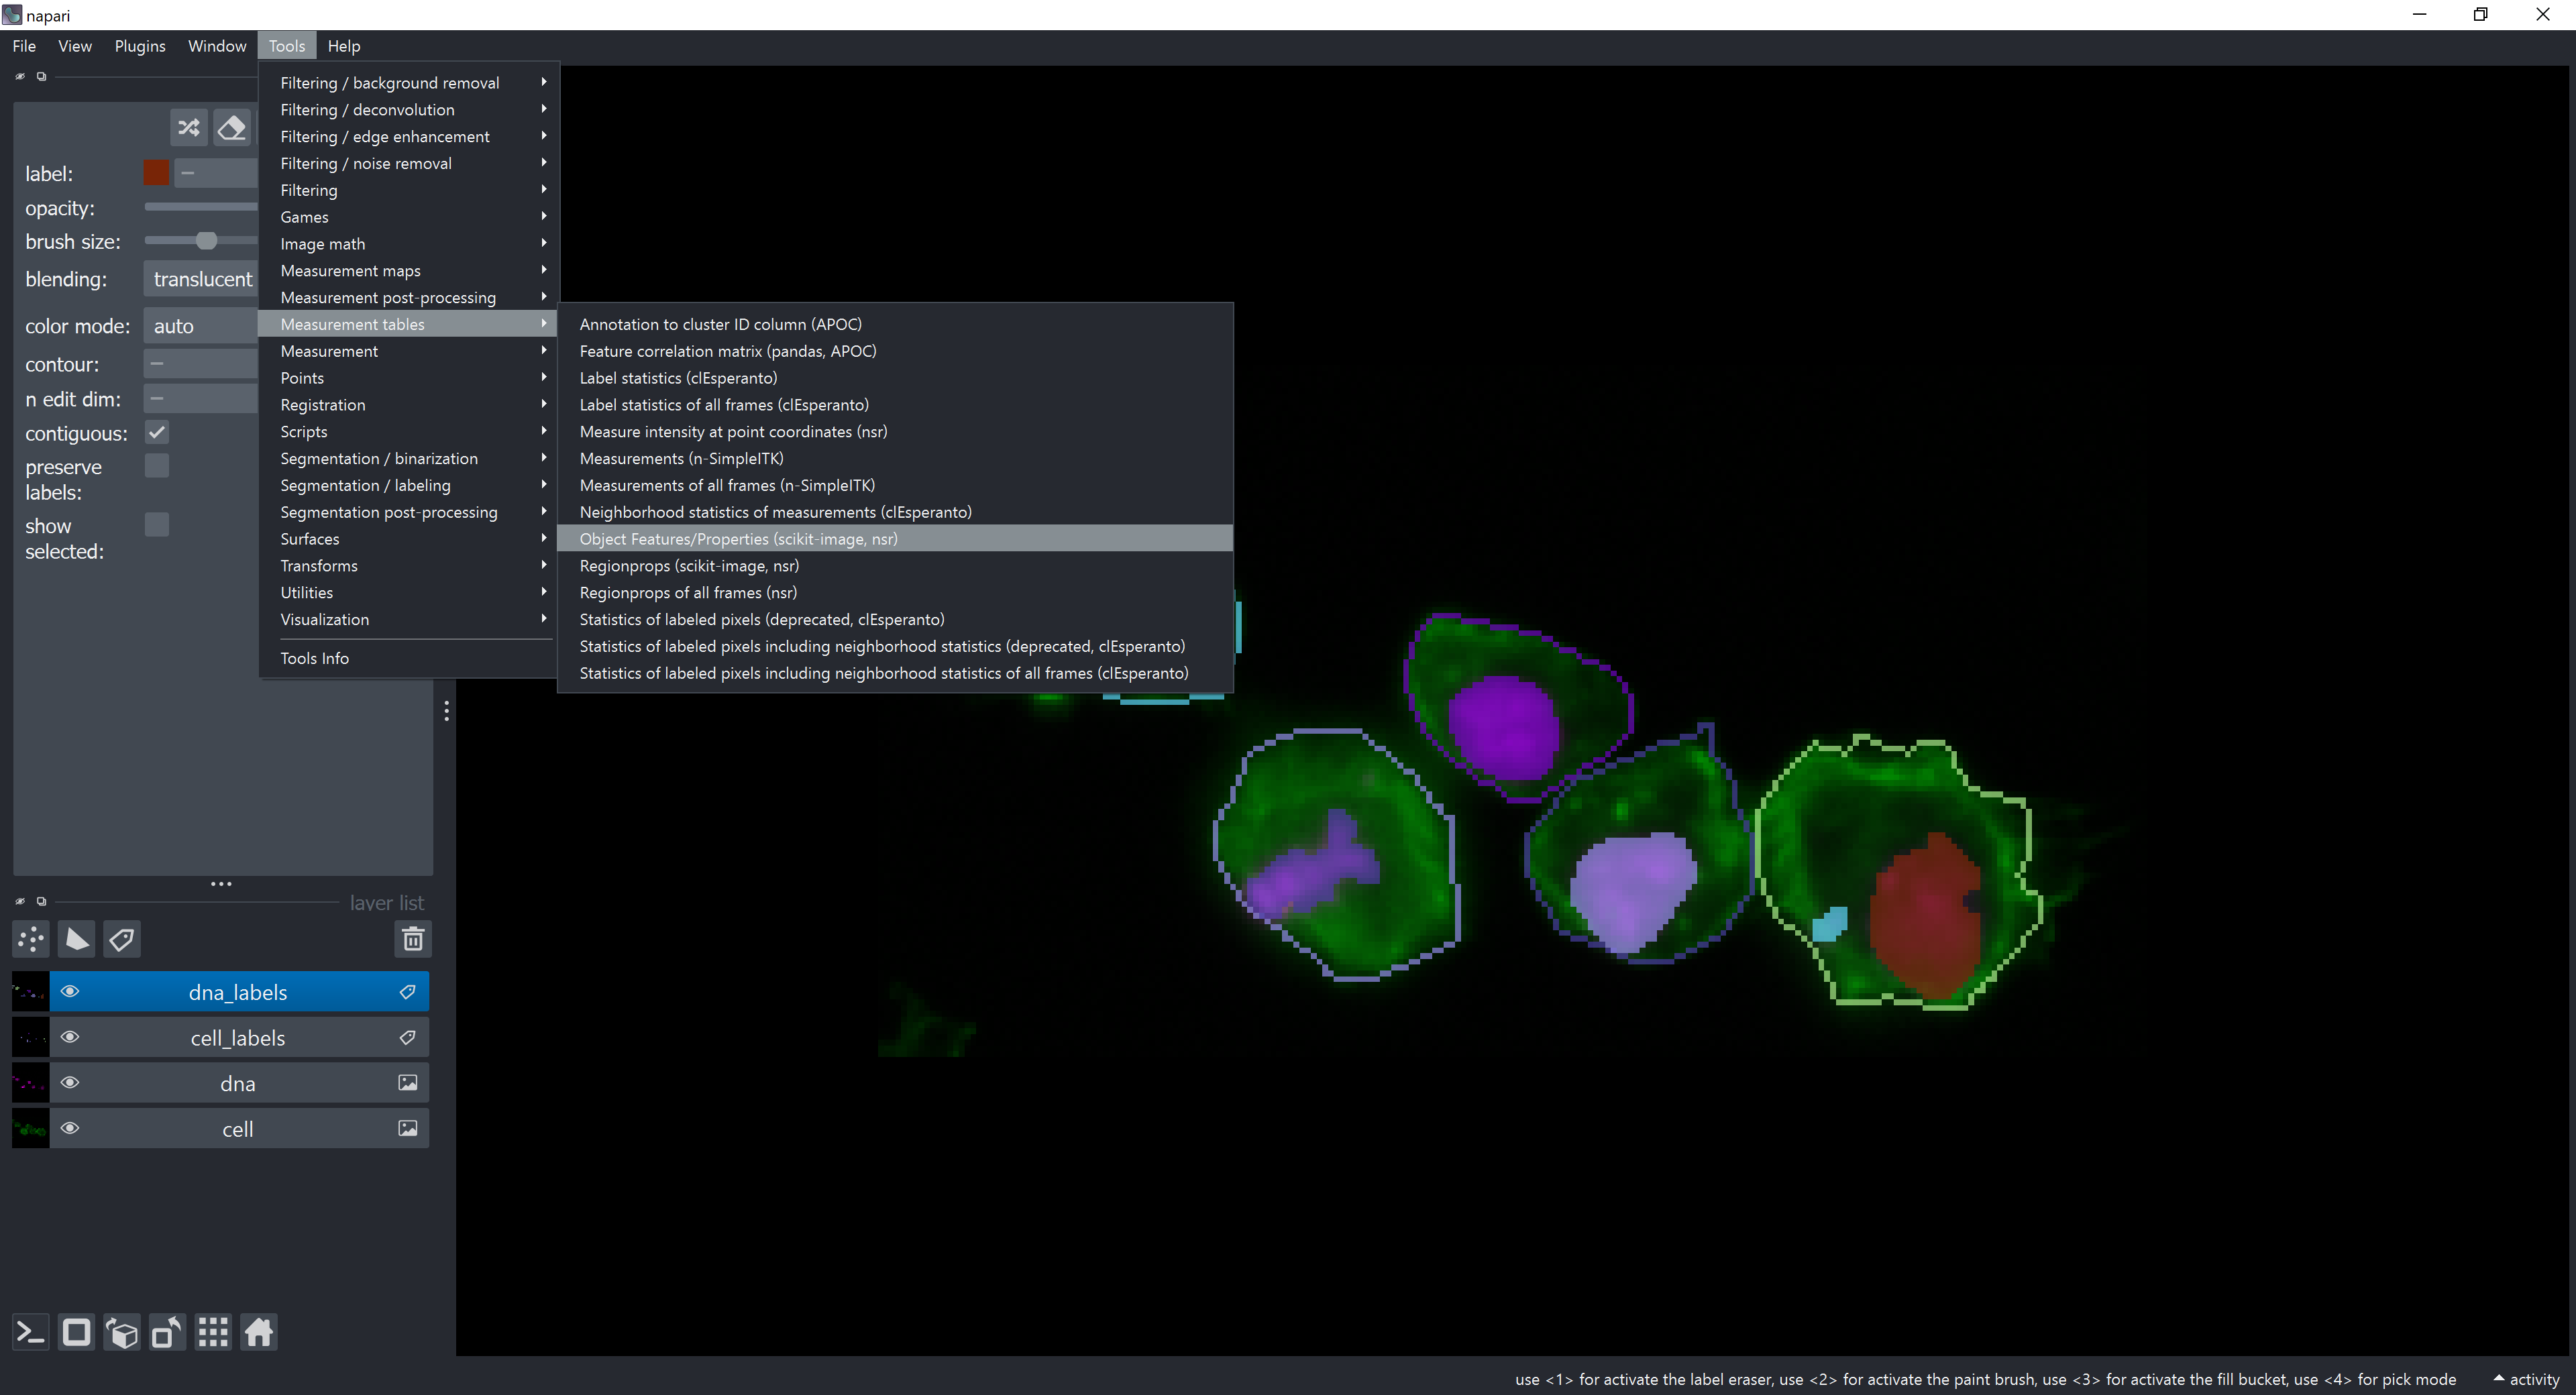
The feature extraction widget should open.
In case of single channel analysis, the Reference Labels Layer should be set to the labels layer of the objects you want to extract features from. We would click on Run and we would be done!
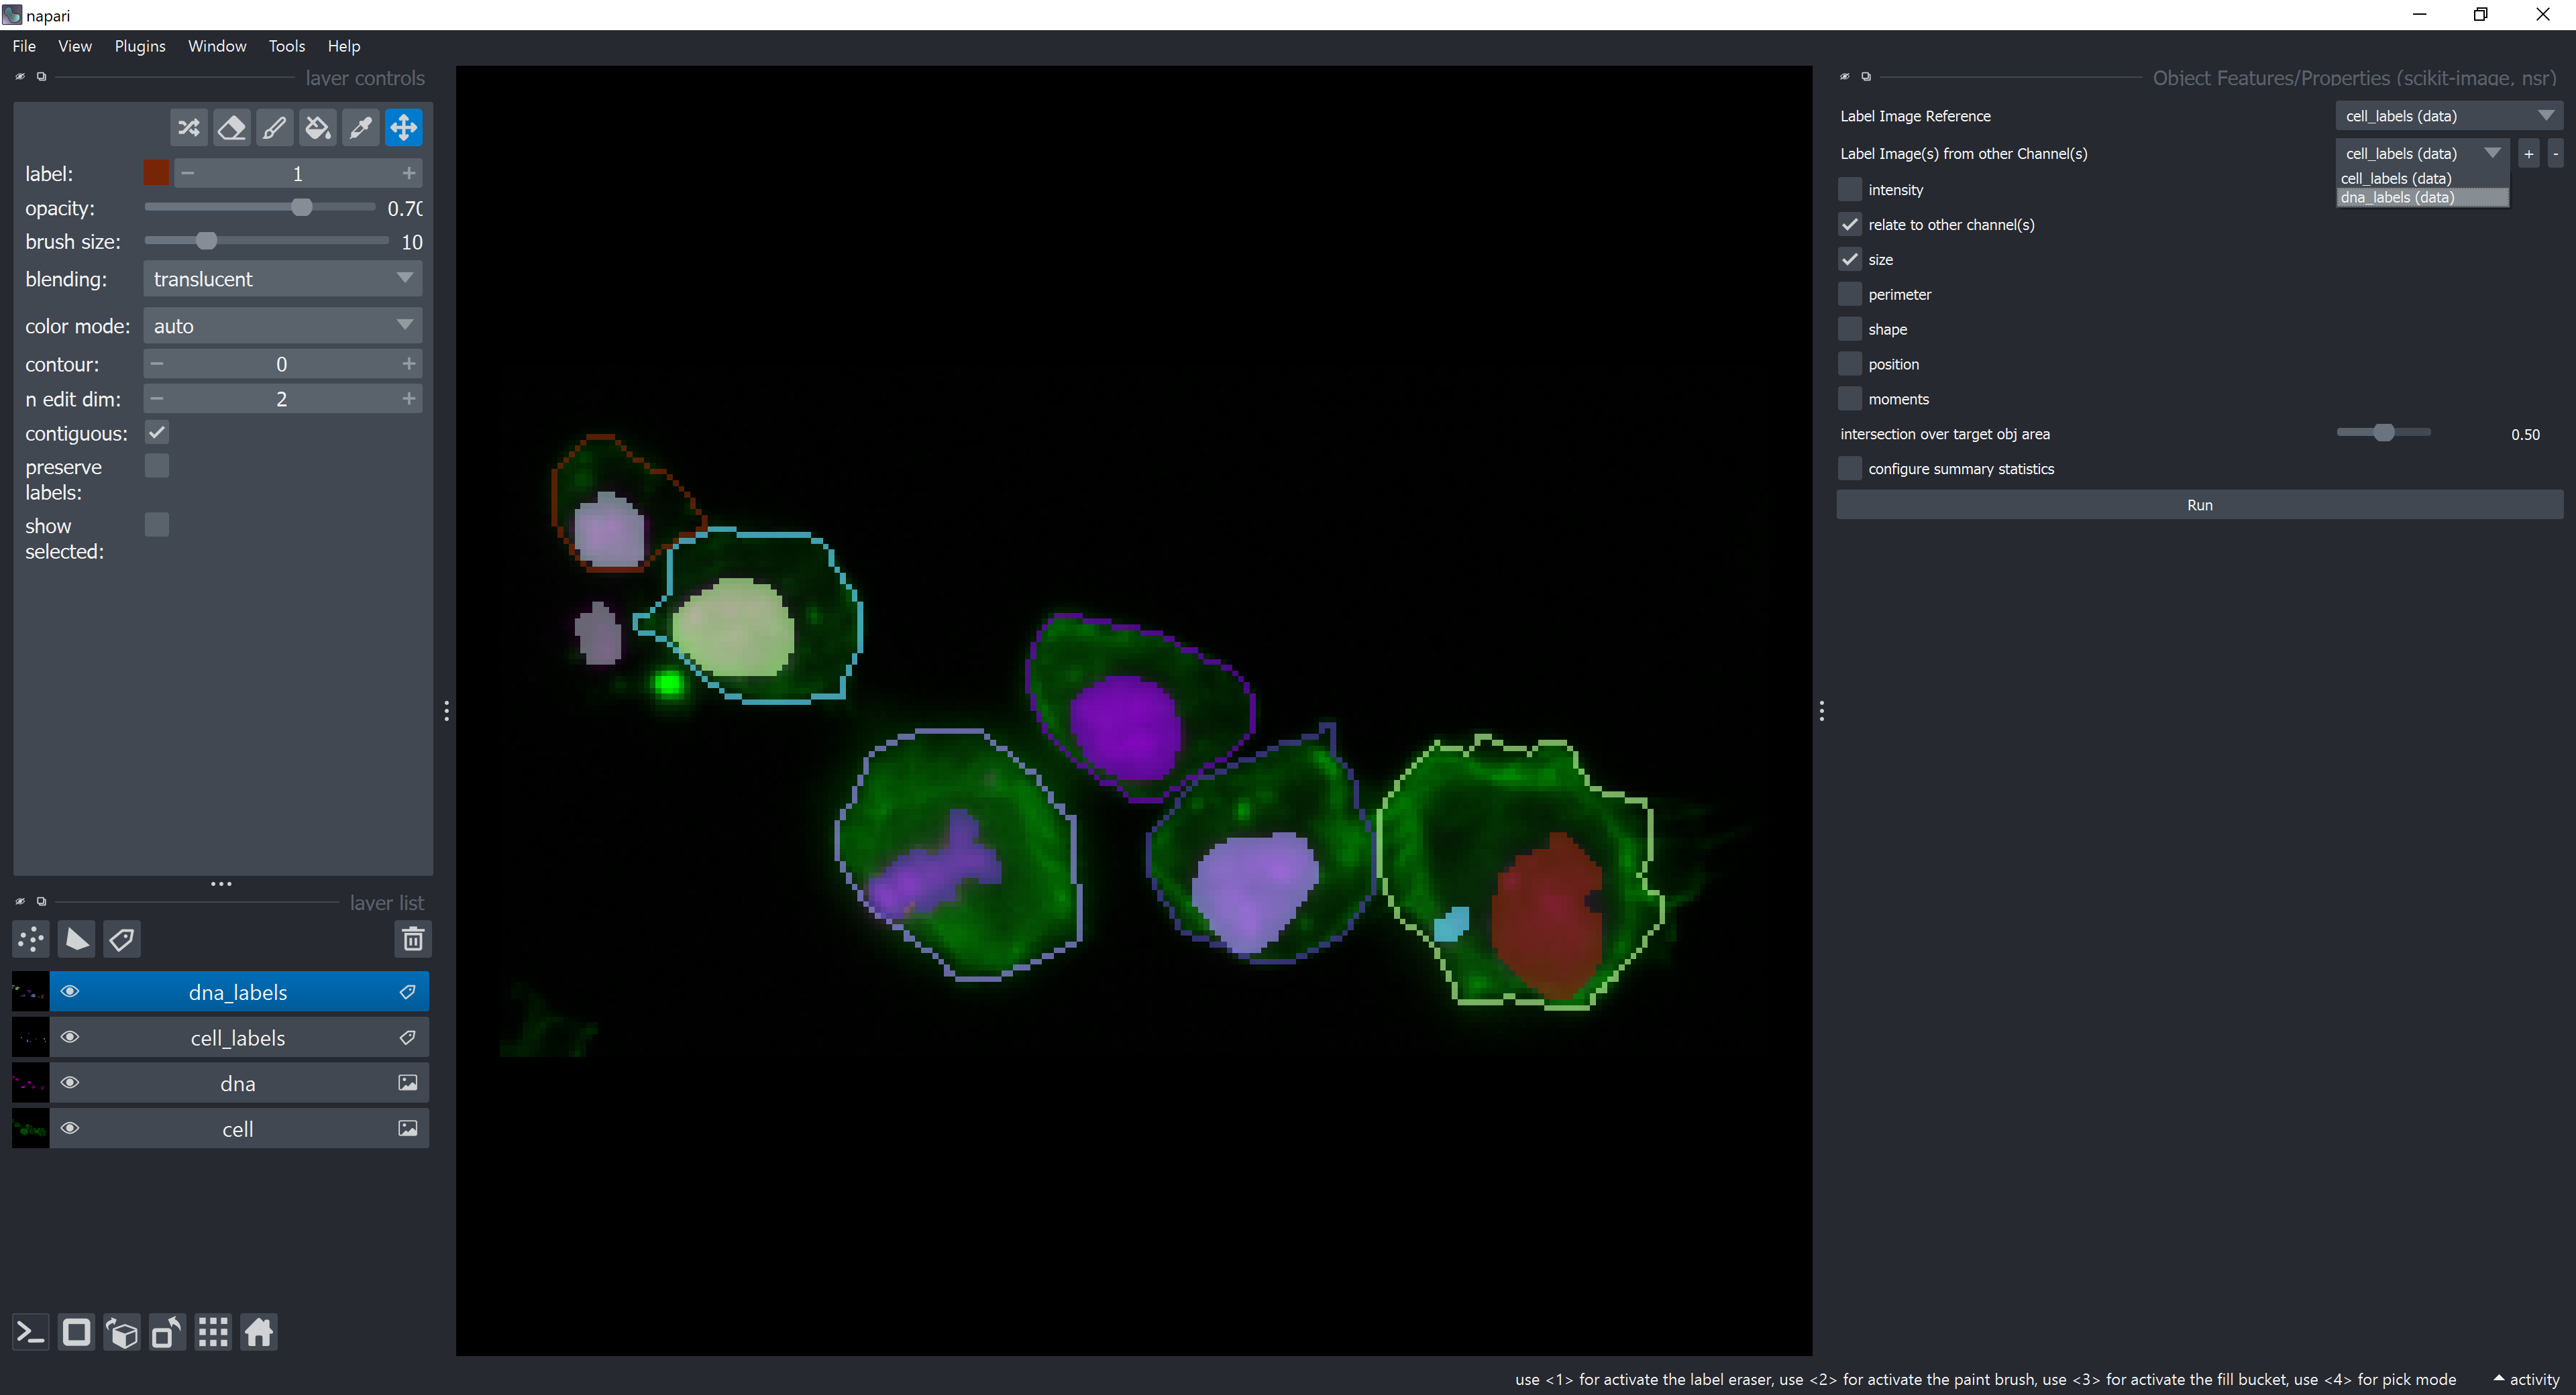
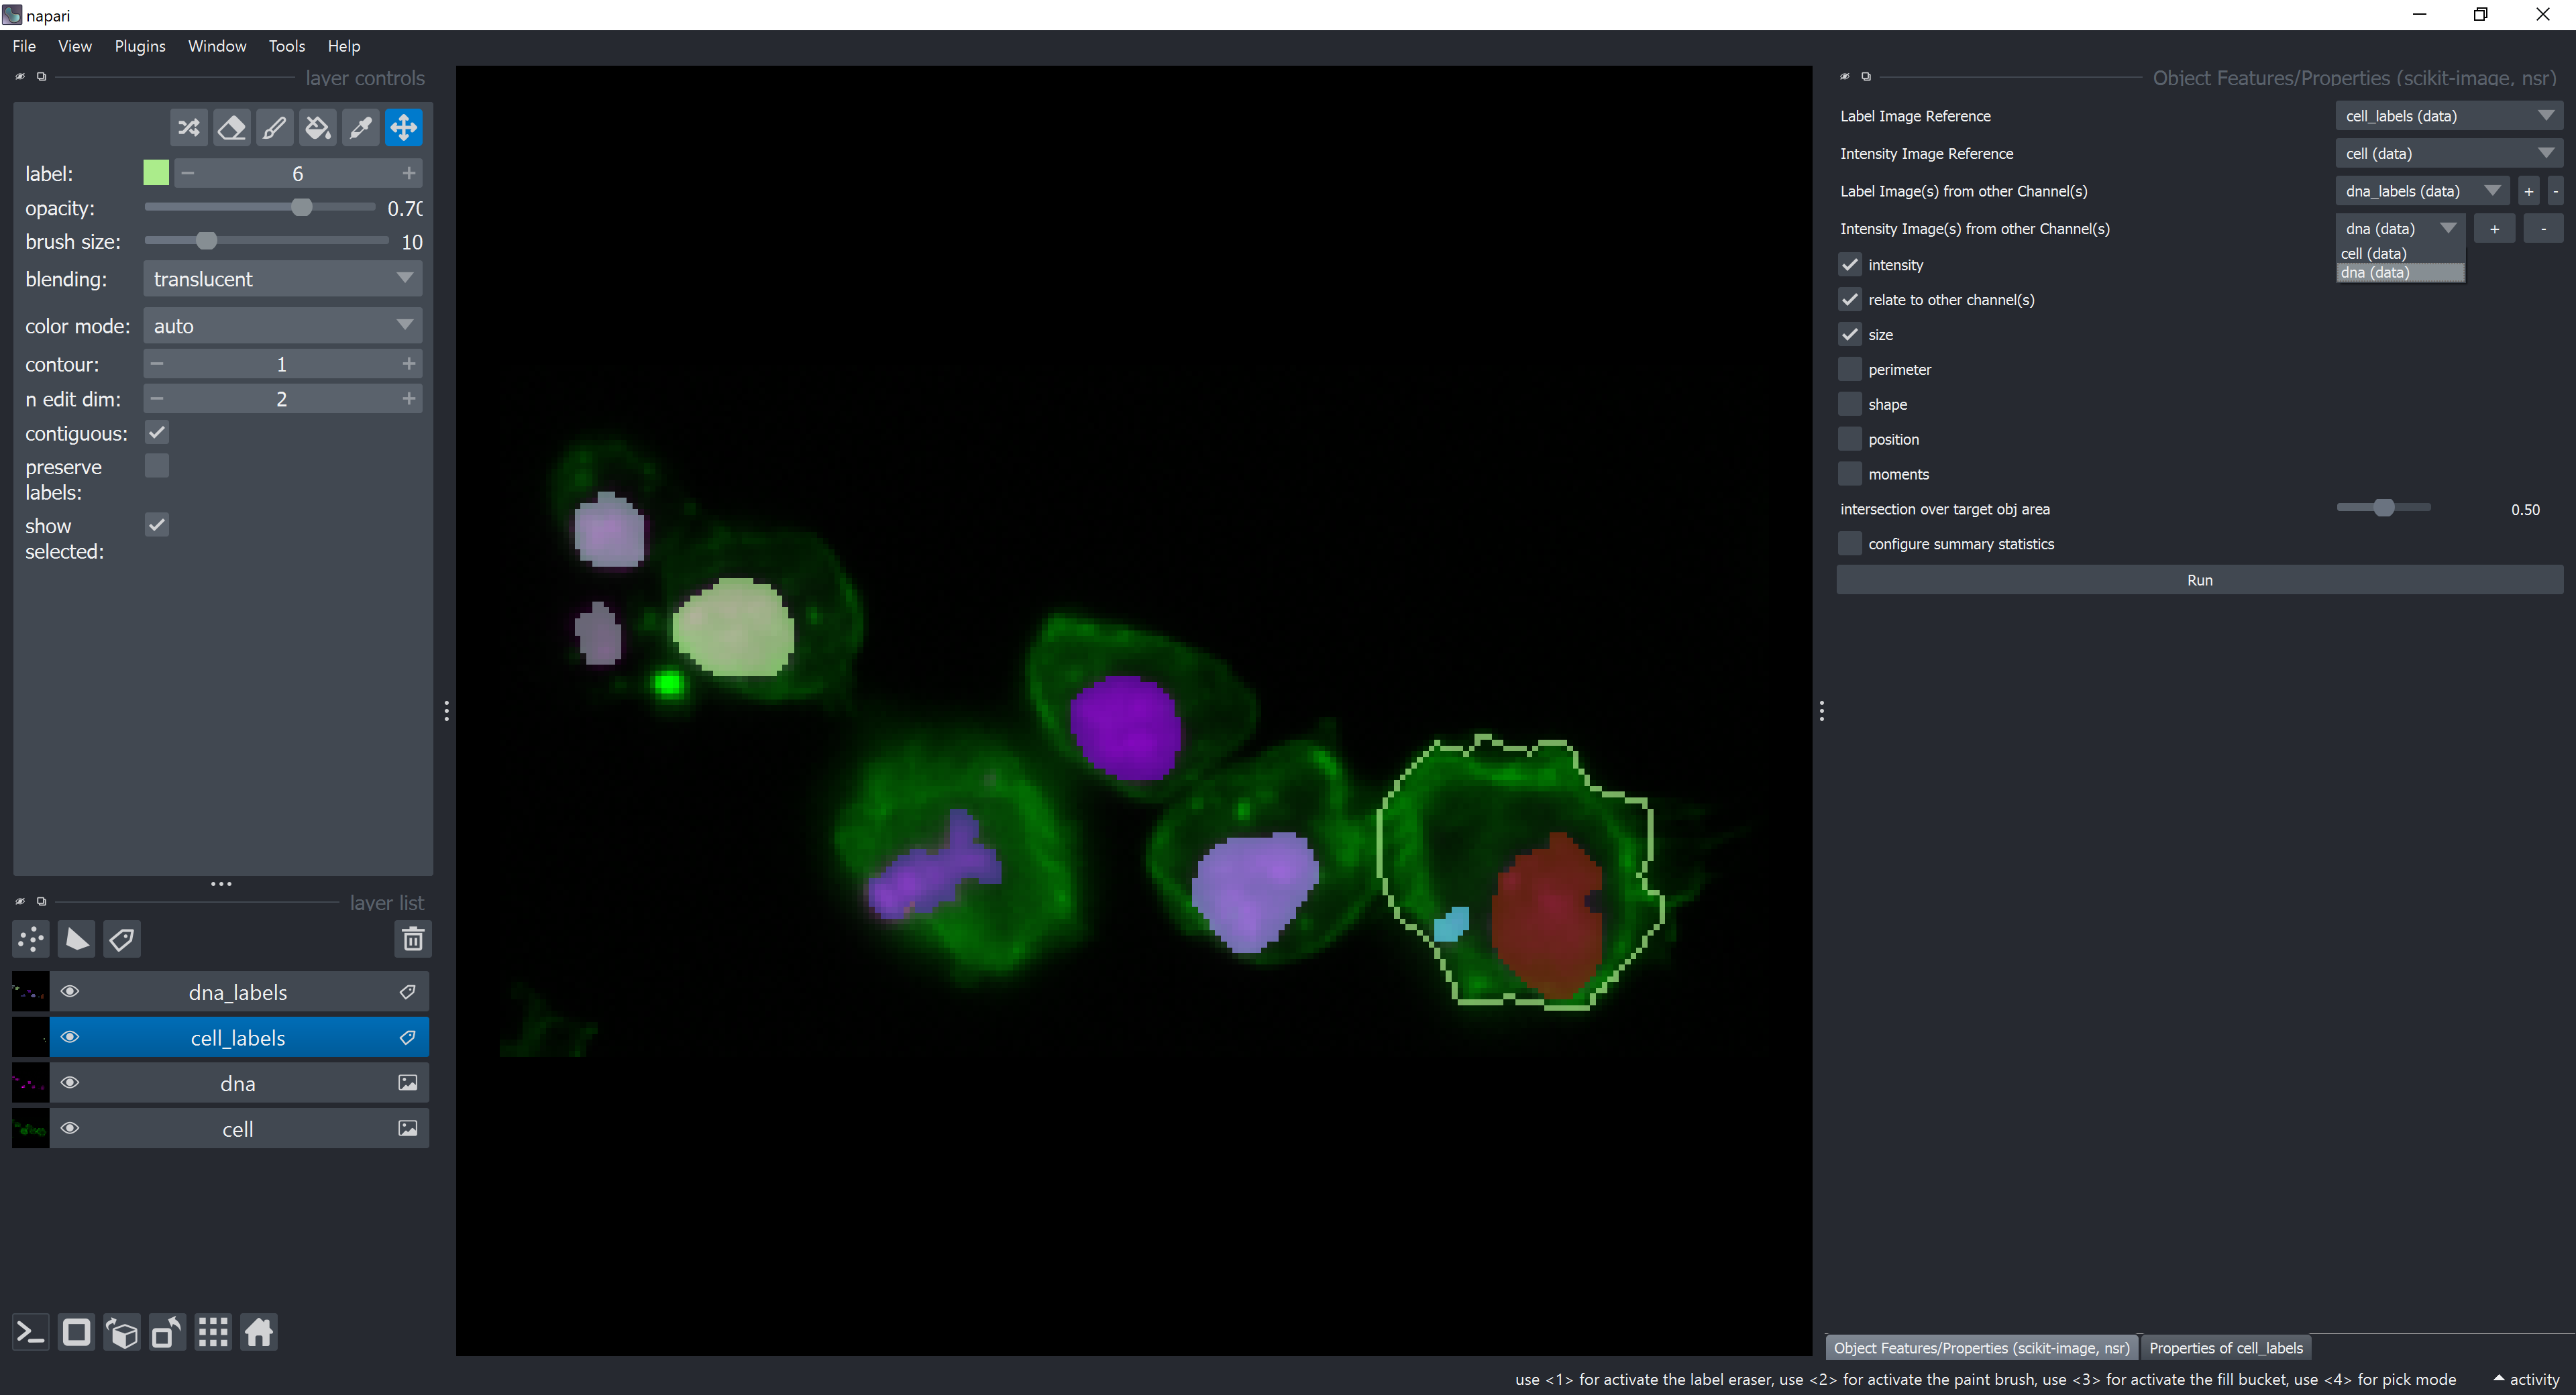
For multichannel analysis, check the relate to other channel(s) checkbox and a new dropdown menu should appear. Select dna_labels in the new dropdown menu.
Now, let’s configure which summary statistics to show. Click on the checkbox configure summary statistics and select counts and unselect average checkboxes. This means we want to count how many objects from the dna_labels layer are contained by each object in the cell_labels layer. Click on Run.
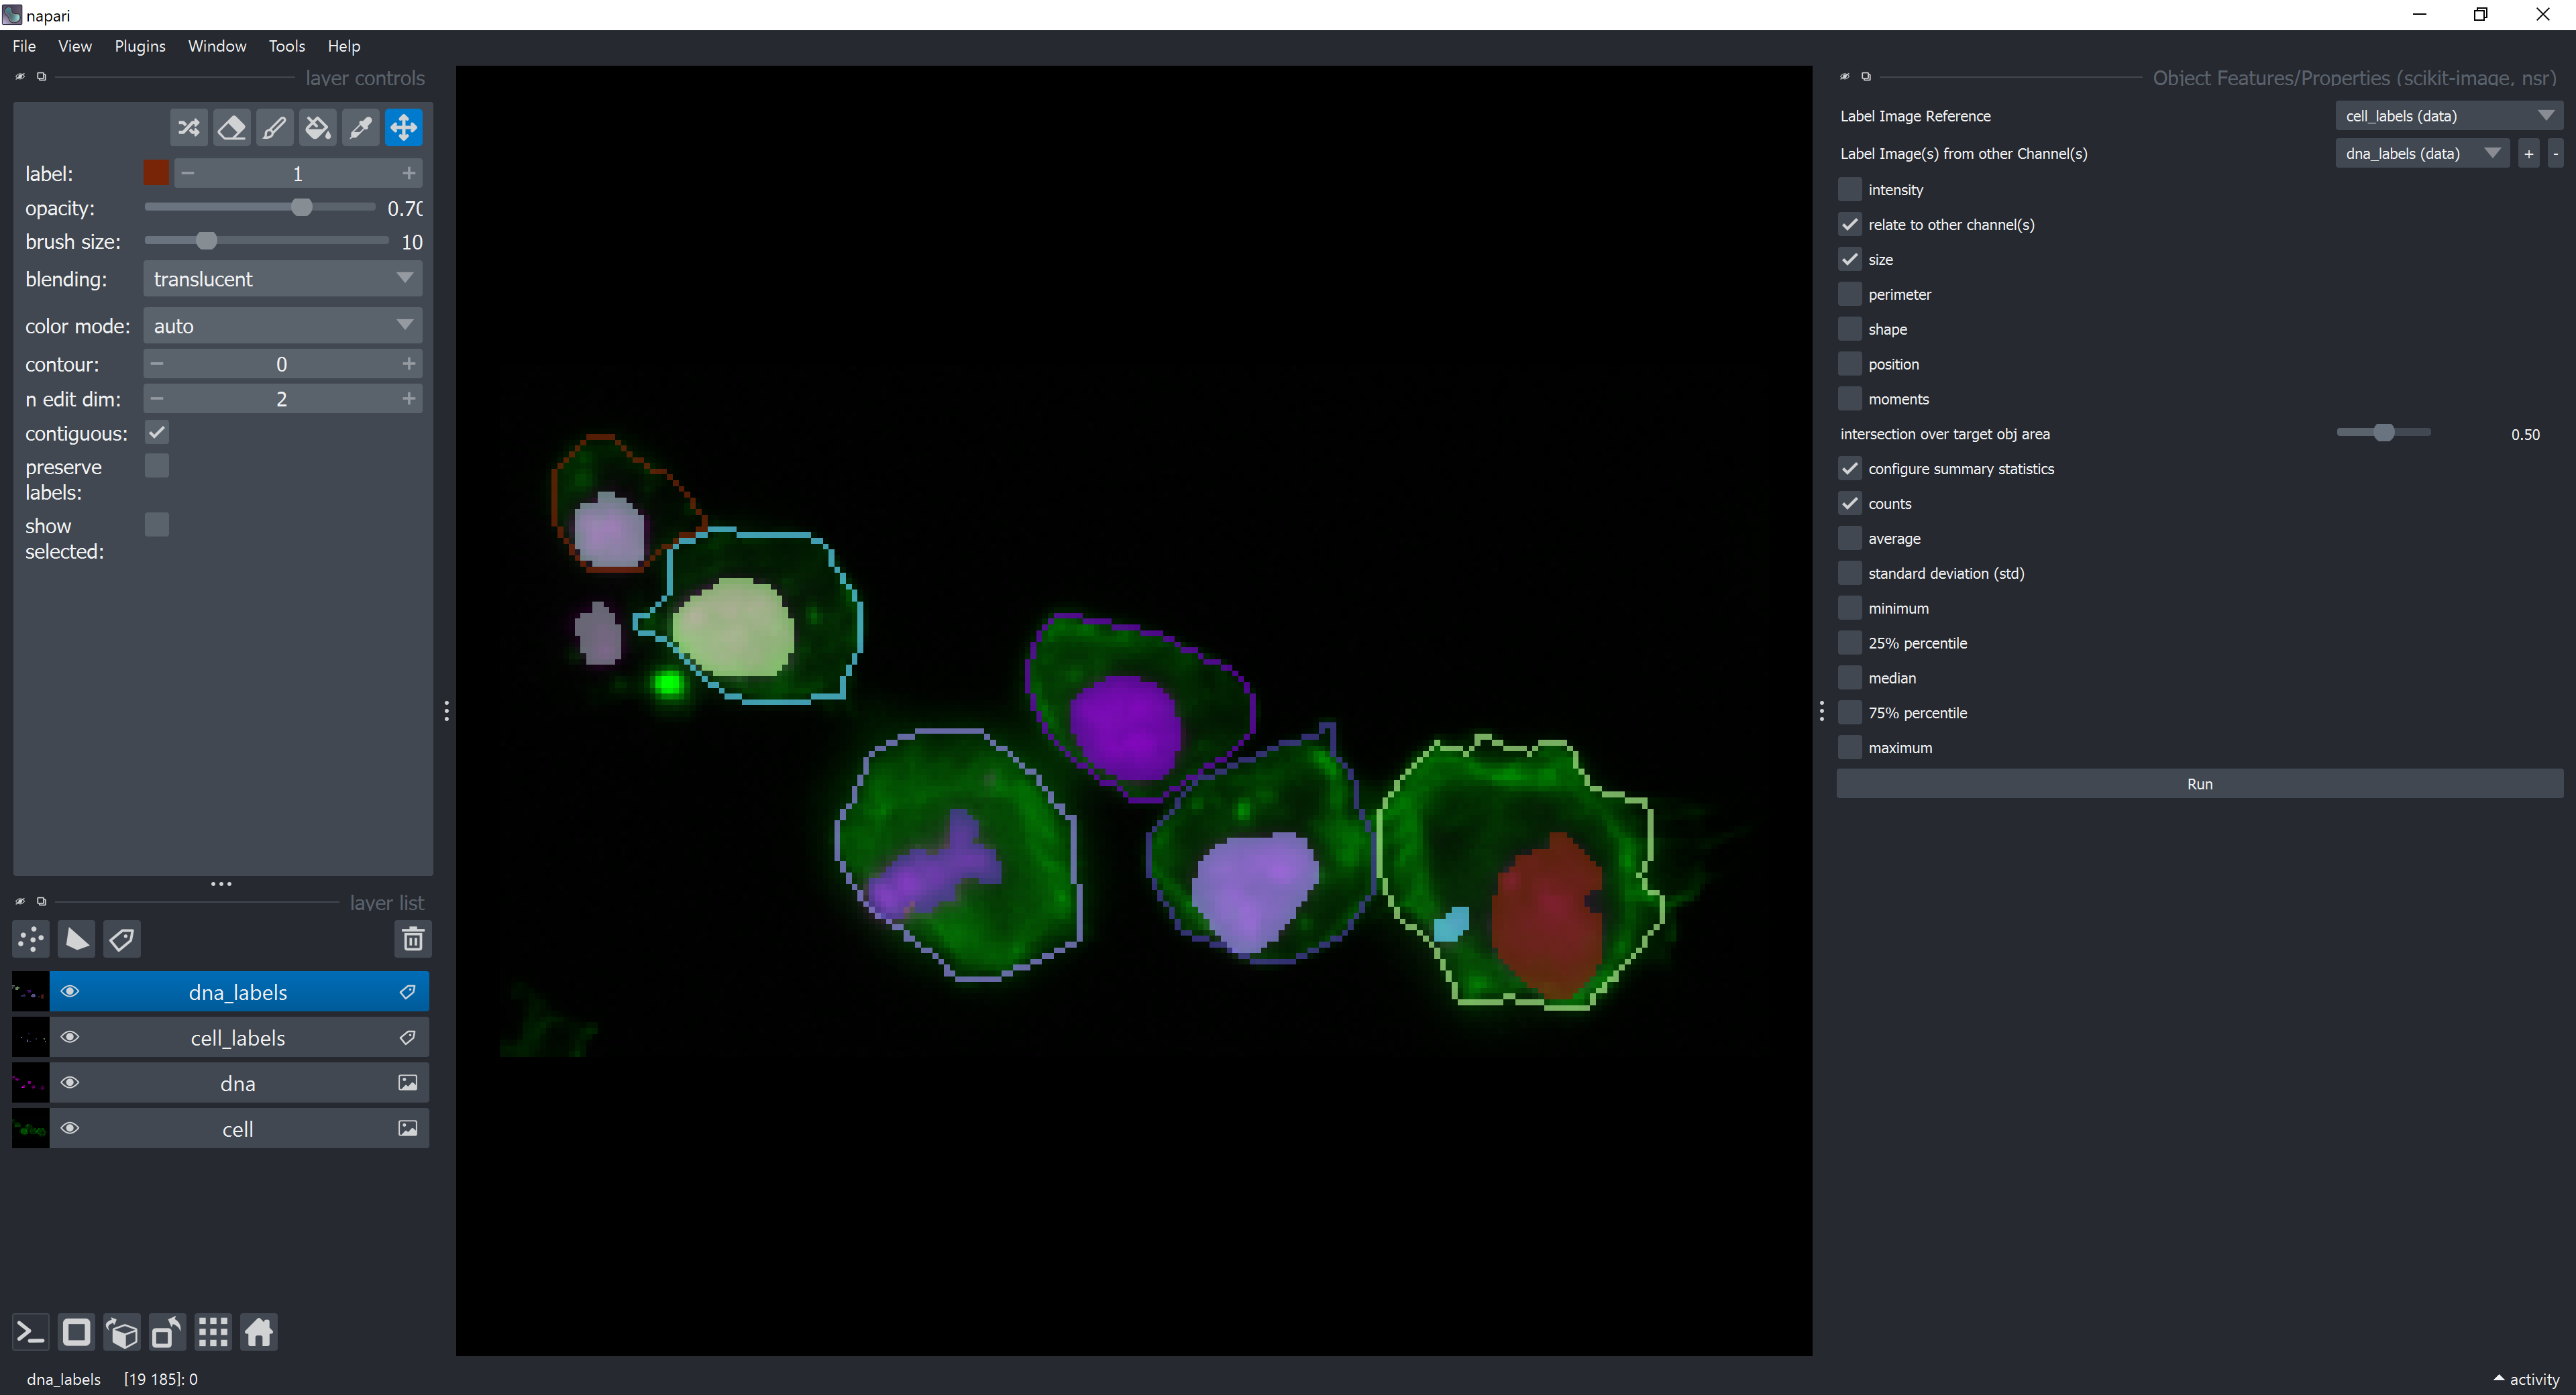
A new table should appear with the summary statistics.
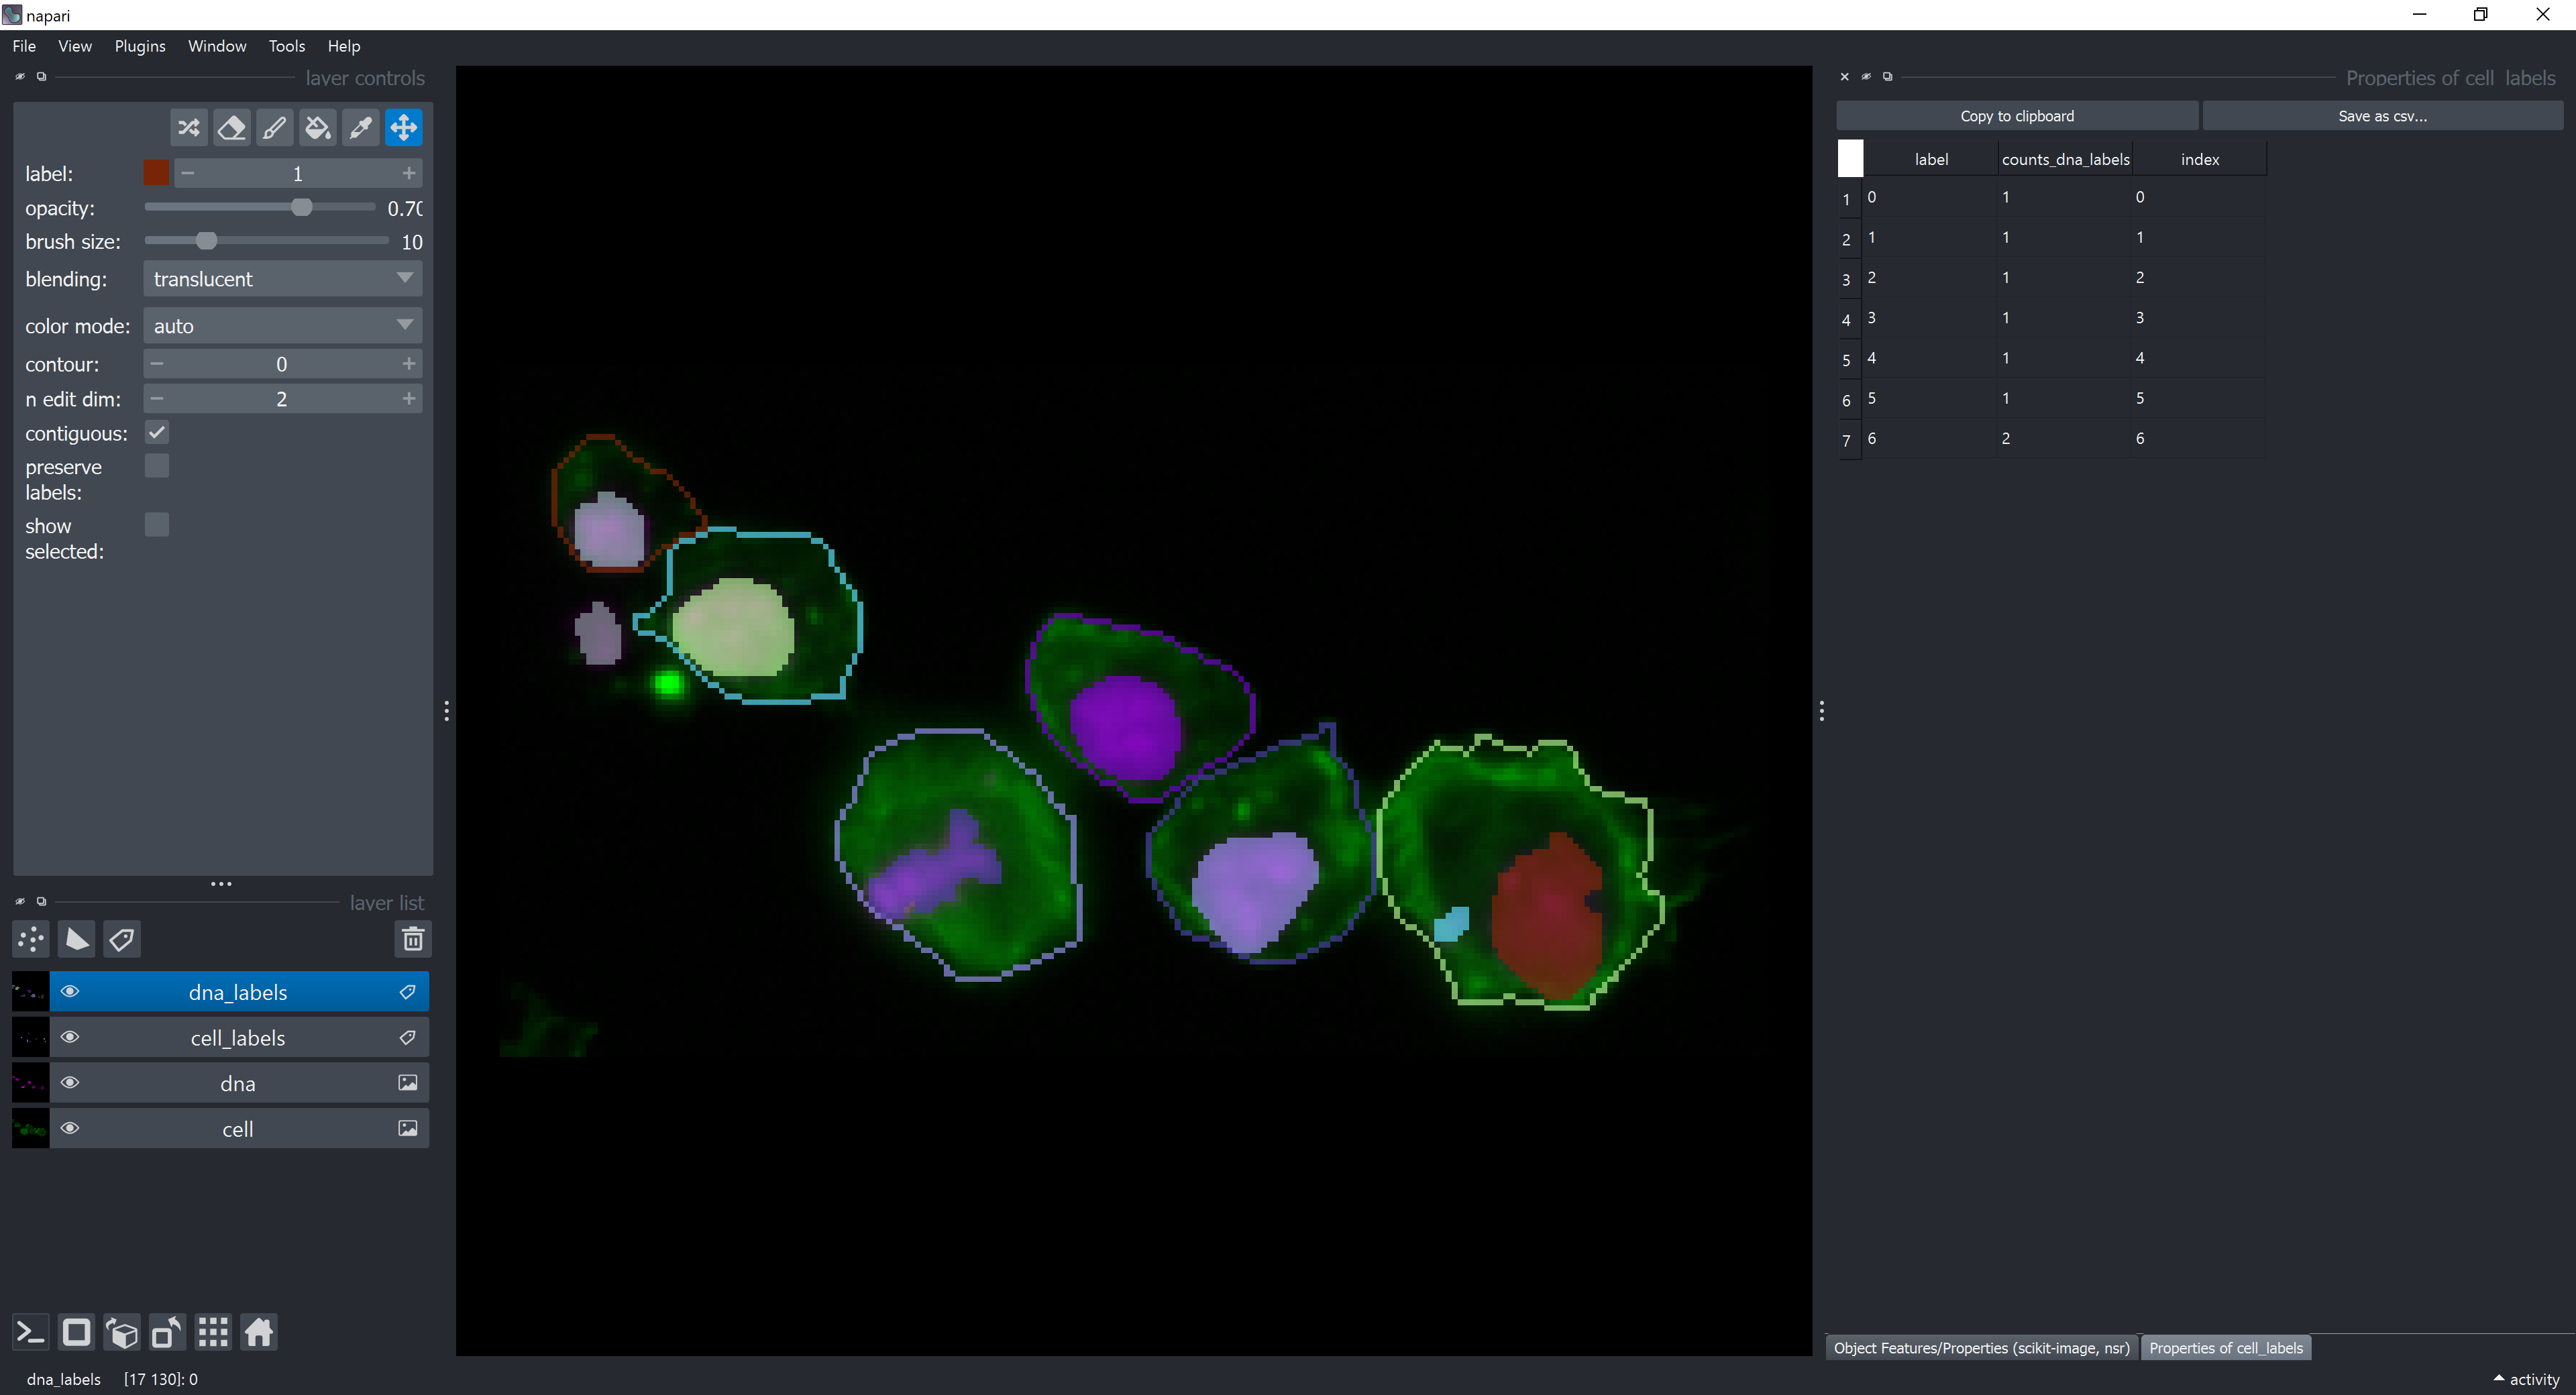
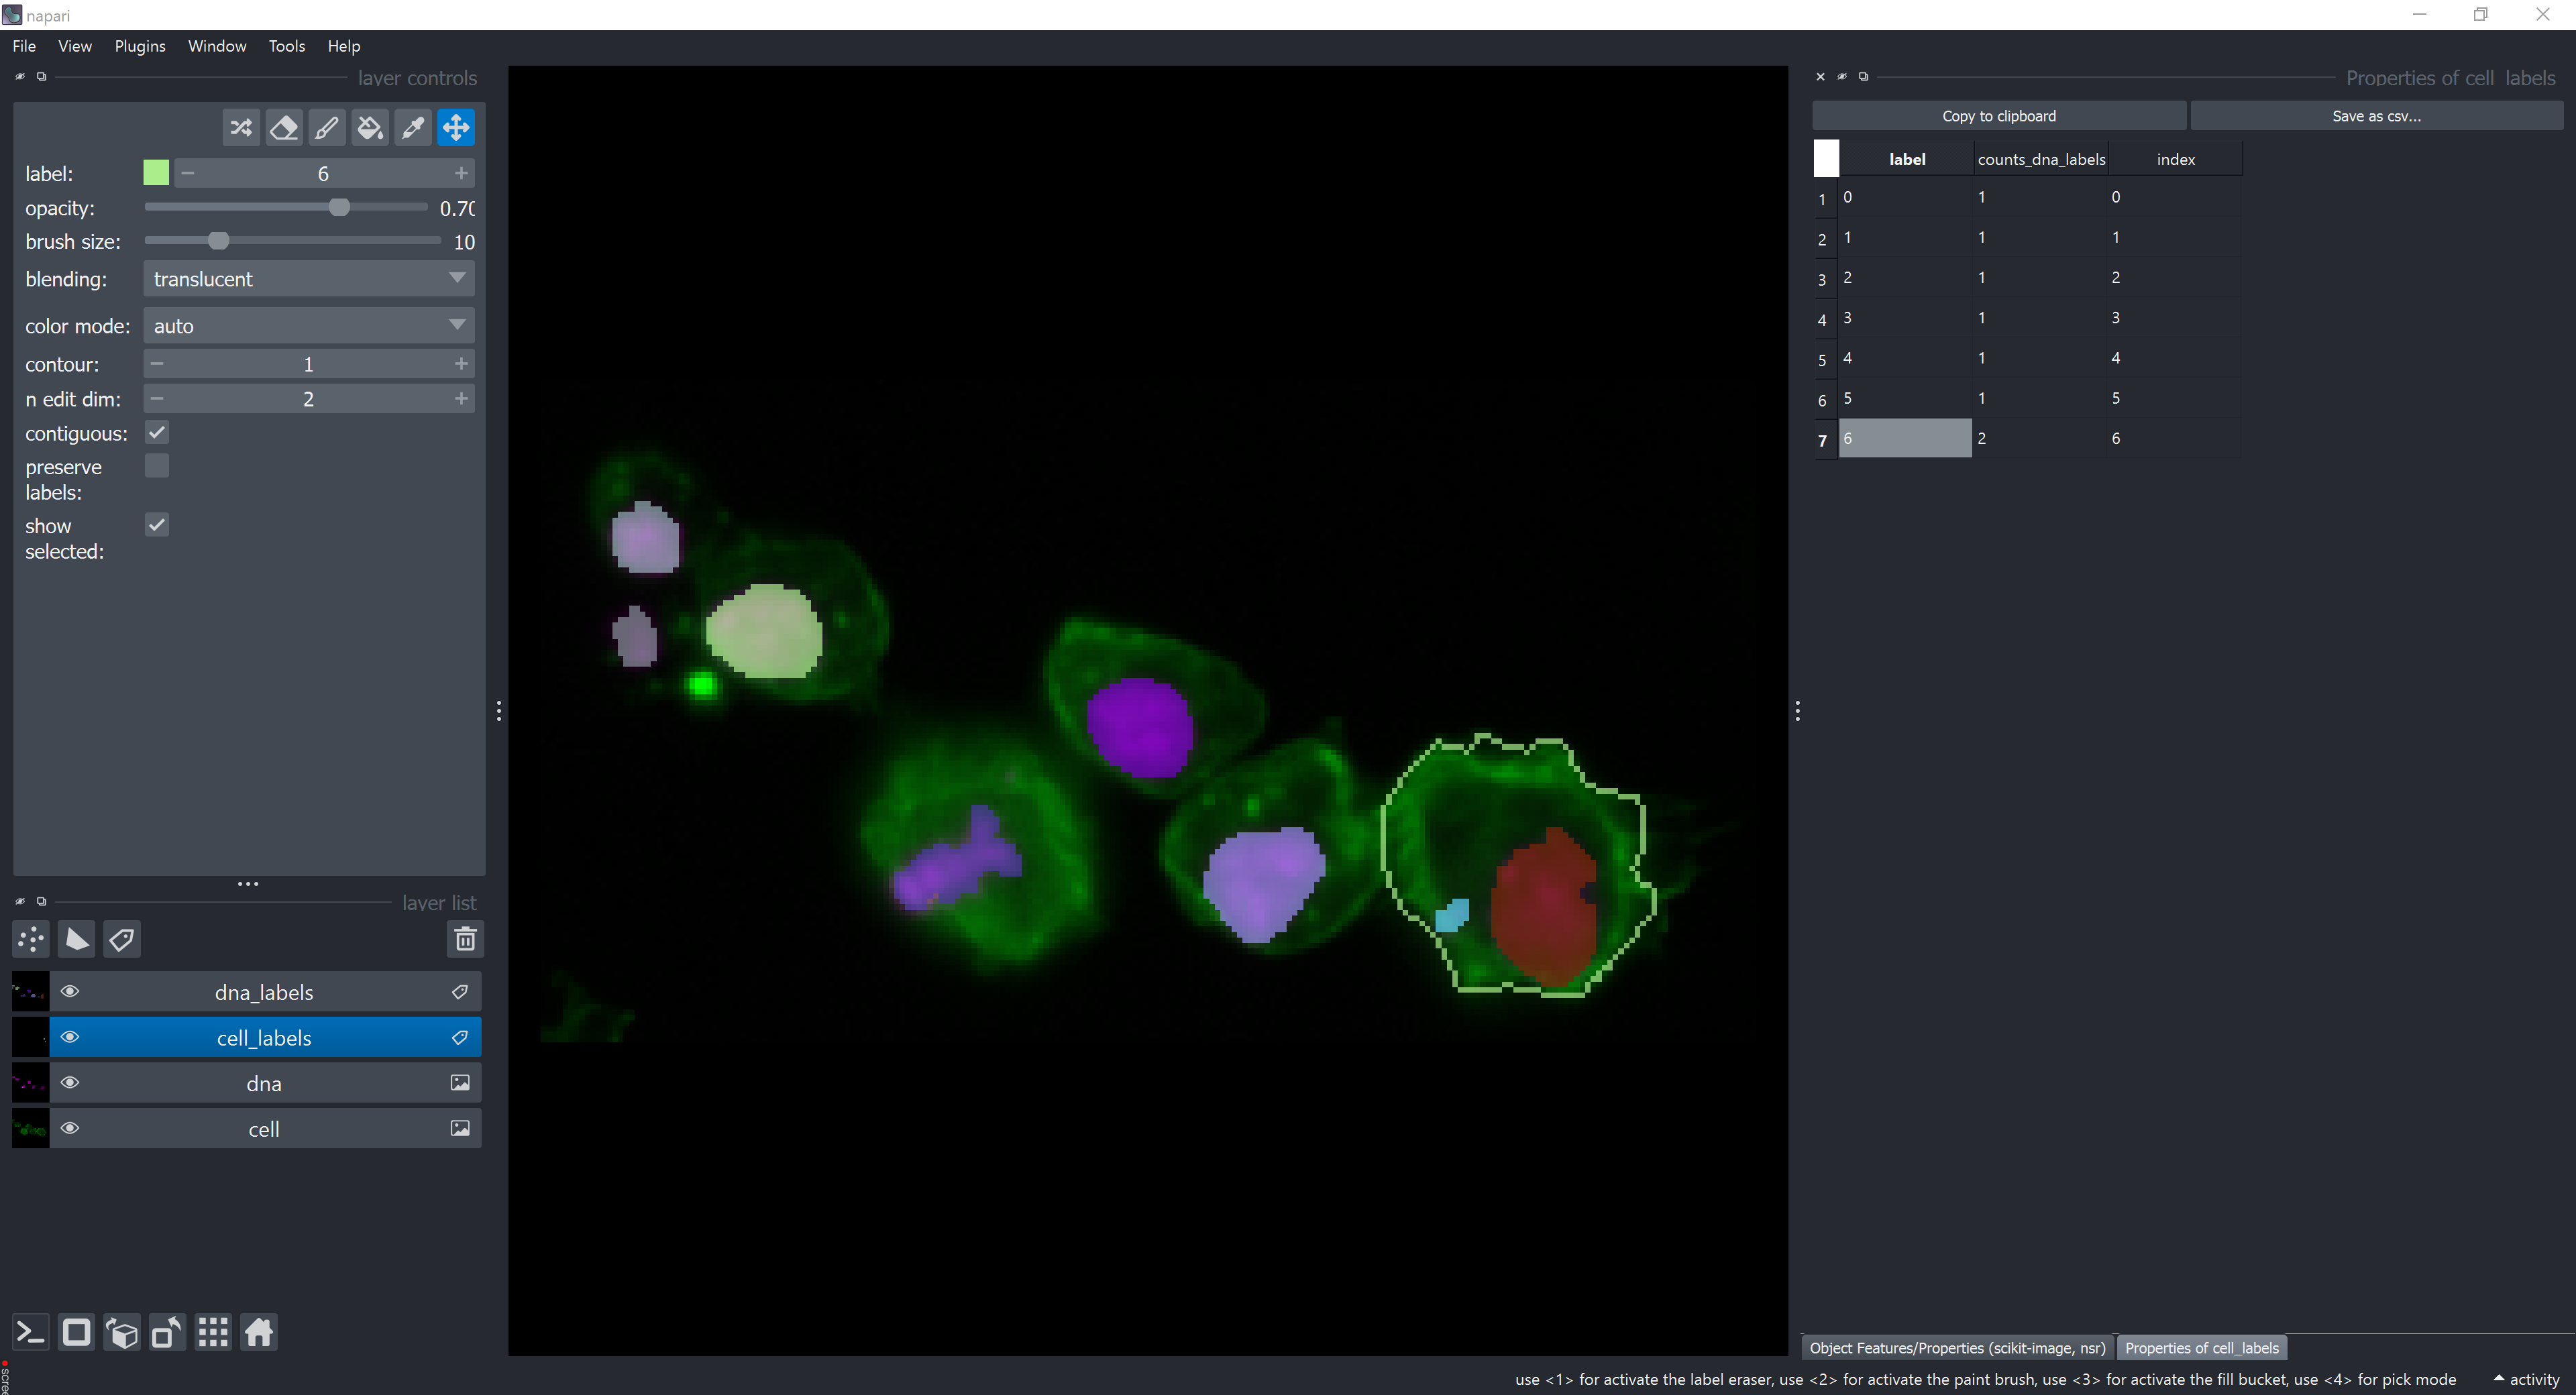
The label column contains the ids (labels) of each cell object in the cell_labels layer. The counts_dna_labels column contains the number of objects from the dna_labels layer that are contained by each cell object in the cell_labels layer. Below is a highlight for the cell label number 6, which is the only one containing more than one object. Label 0 refers to the background.
Now, let’s add some intensity measurements. Click on the intensity checkbox and select the actin image layer in the Intensity Image Reference dropdown menu and the dna image layer in the Intensity Image(s) from other Channel(s).
Click on configure summary statistics and select back the average checkbox. Click on Run. A new table should appear with more columns than before. They represent average of dna features contained by each cell. For example, the average of the mean_intensity feature of dna elements contained by each cell is displayed in the column mean_intensity_dna_labels_average.
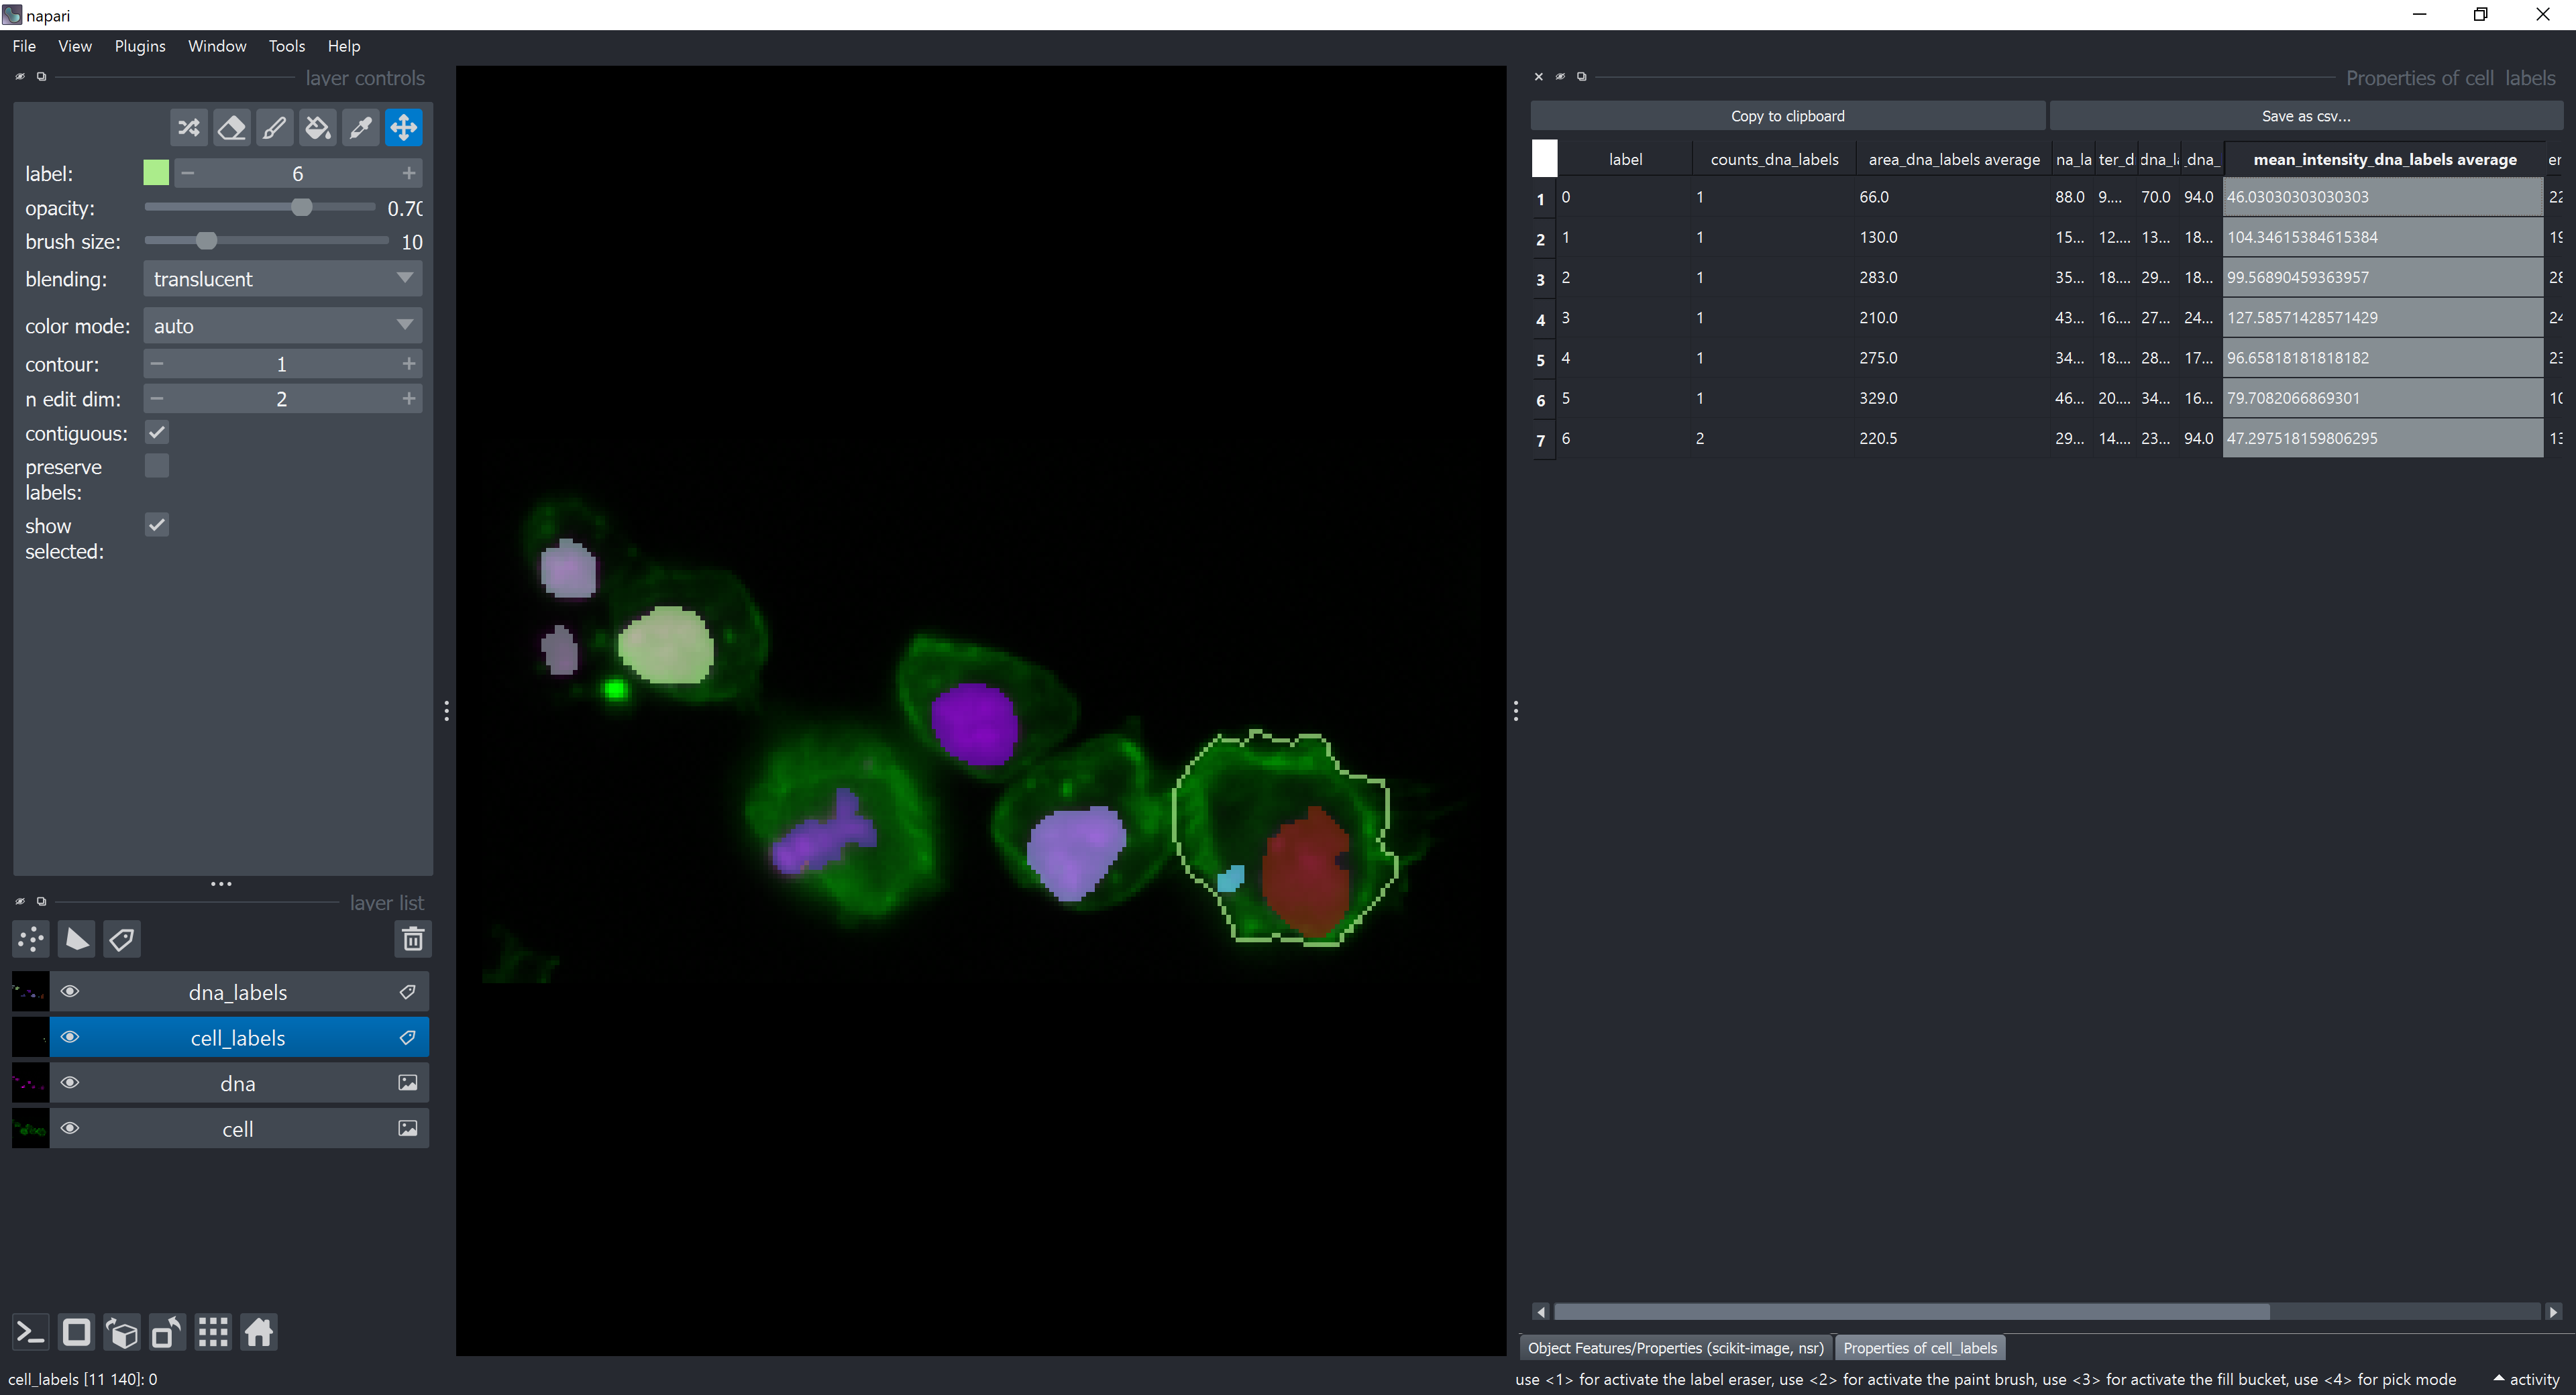
This table can be saved as a .csv file by clicking on the Save as csv... button.