Plotting#
The plotter widget is the heart of the napari-clusters-plotter. To open it, open a napari viewer and find the Plotter Widget either under
Layers > Visualize > Plot & select features (napari-clusters-plotter)Plugins > napari-clusters-plotter > Plot & select features (napari-clusters-plotter)
Widget overview#
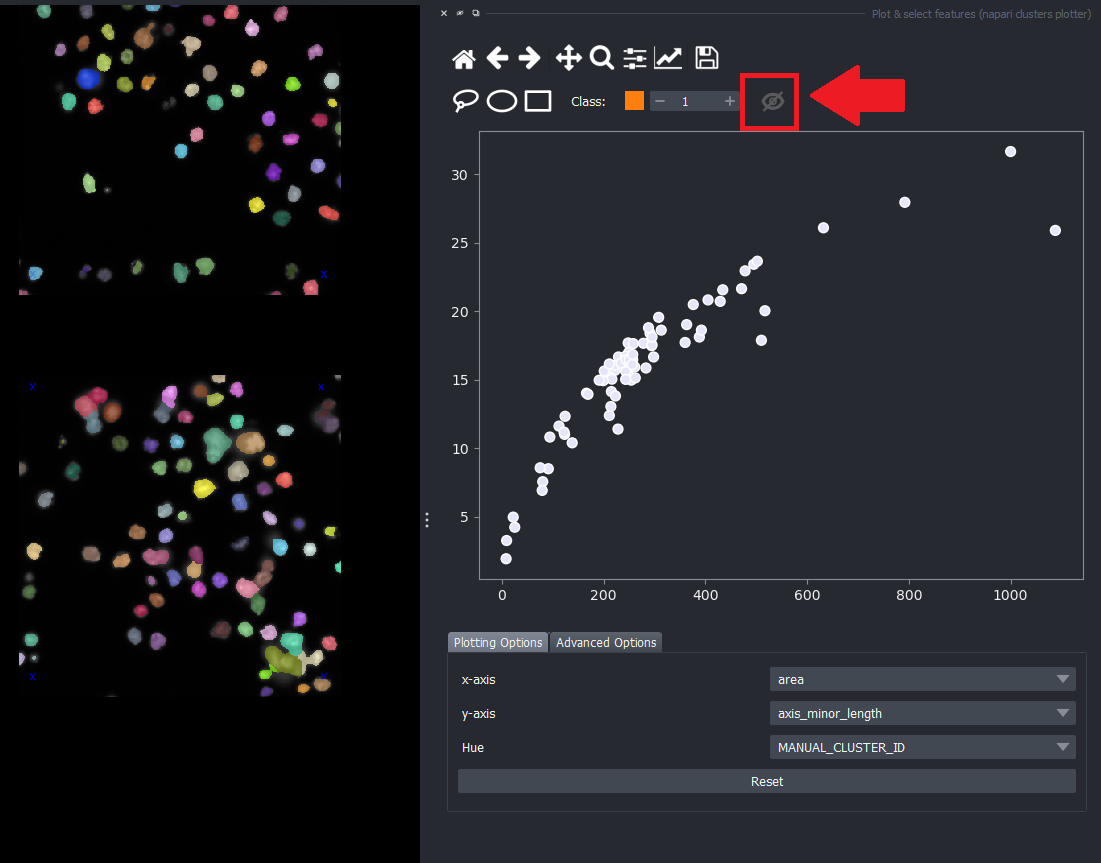
The core functionality of the plugin is available to you directly upon opening it:
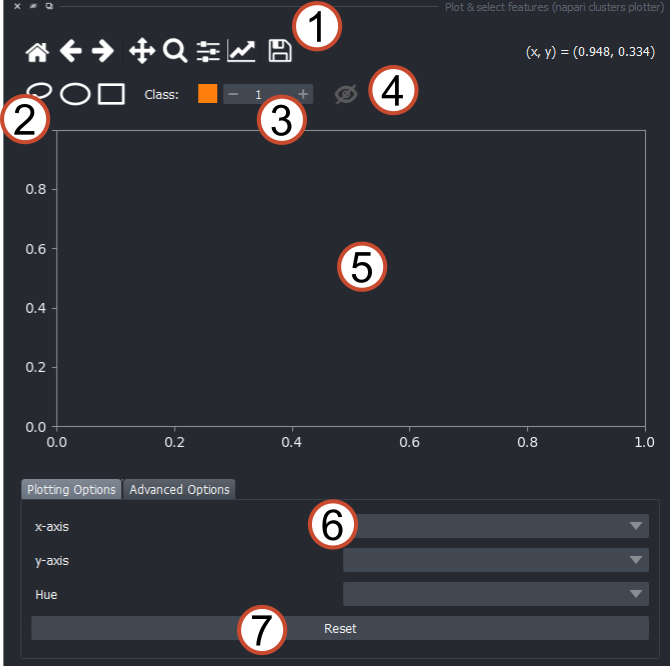
Standard matplotlib toolbar: Reset, Undo/Redo, Pan, Zoom, other plot properties & export
Tools to select points on the canvas:
Lasso selector
Ellipse selector (drag and drop, confirm with rightclick)
Rectangle selector (drag & drop, confirm with right-click)
Selected cluster index: Depending on which color/number is selected here, regions in the plot will be counted as members of this cluster group and highlighted accordingly
Show/Hide: Show or hide the selected points or histogram bins on the canvas.
Canvas: Features will be visualized here
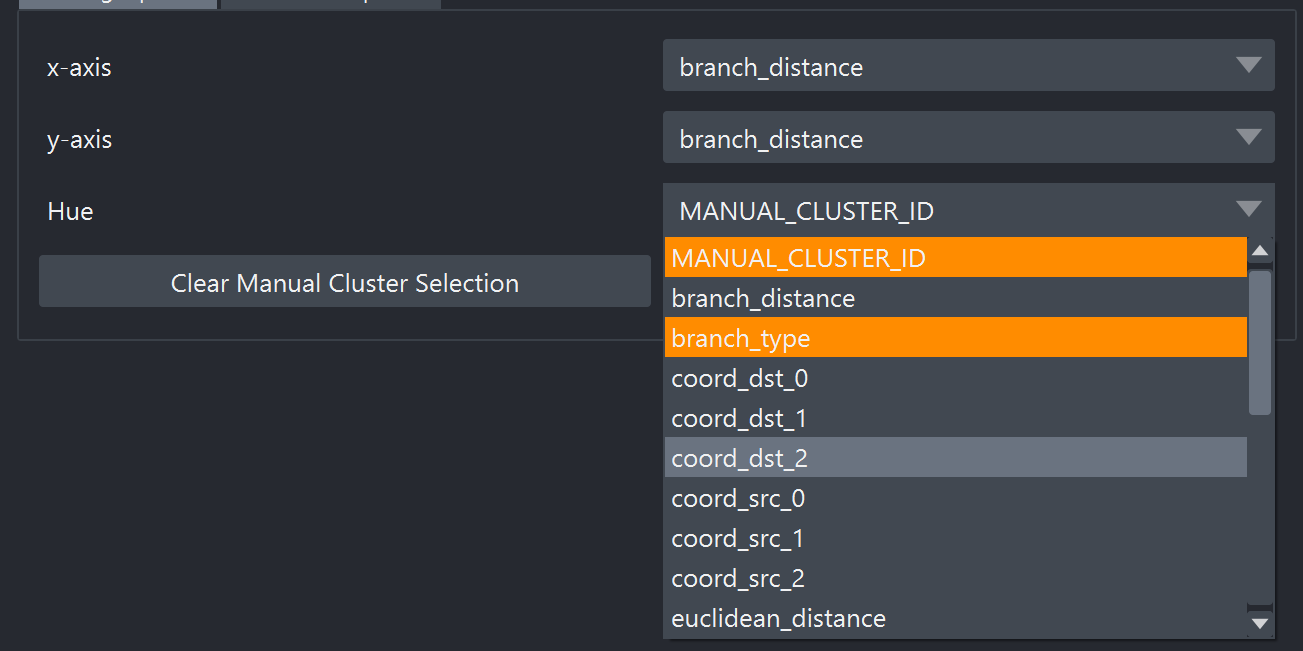
What feature to plot on the x-axis and y-axis, respectively. The
Huedropdown controls the coloring of the data on the canvas, categorical features are highlighted in orange.Reset button: Resets all drawn clusters
Copy button: Copies the currently selected objects according to selector 3 to a new layer. All respective features will be copied over to the new layer accordingly.
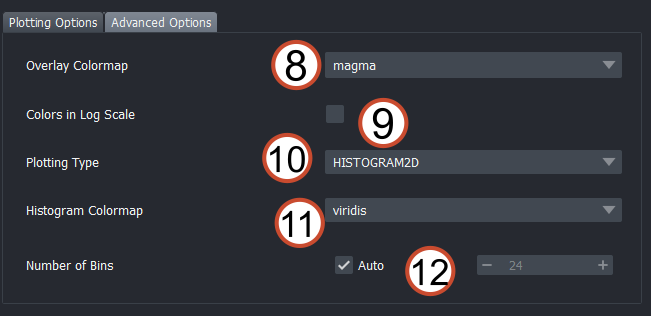
Under the Advanced Options tab, you have access to some more customization options for the visualization:
Change the colormap for the chosen overlay color. If a layer is colored by a non-categorical feature, this determines the colormap for the depiction. Only enabled if a non-categorical feature is selected in the
Huedropdown.Apply a log-scale to the chosen feature
Switch plot type between
SCATTERandHISTOGRAM2DColorap for 2D histogram (only enabled if
HISTOGRAM2Dis selected in 10.)Change the size of the bins (only enabled if
HISTOGRAM2Dis selected in 10.)
Visualizing layer features#
In order to visualize features from a dataset, you can load some of the sample data which accompanies the napari-clusters-plotter. You find the sample datasets under File > Open Sample > napari-clusters-plotter > .... In this tutorial, we will use the BBBC1 dataset & segmentations dataset, (Jones et al., Proc. ICCV Workshop on Computer Vision for Biomedical Image Applications, 2005), available from the Broad Bioimage Benchmark Collection [Ljosa et al., Nature Methods, 2012] (Link to data source)
The features of a Labels layer can be loaded into the Plotter Widget simply by selecting it in the layer list on the left:
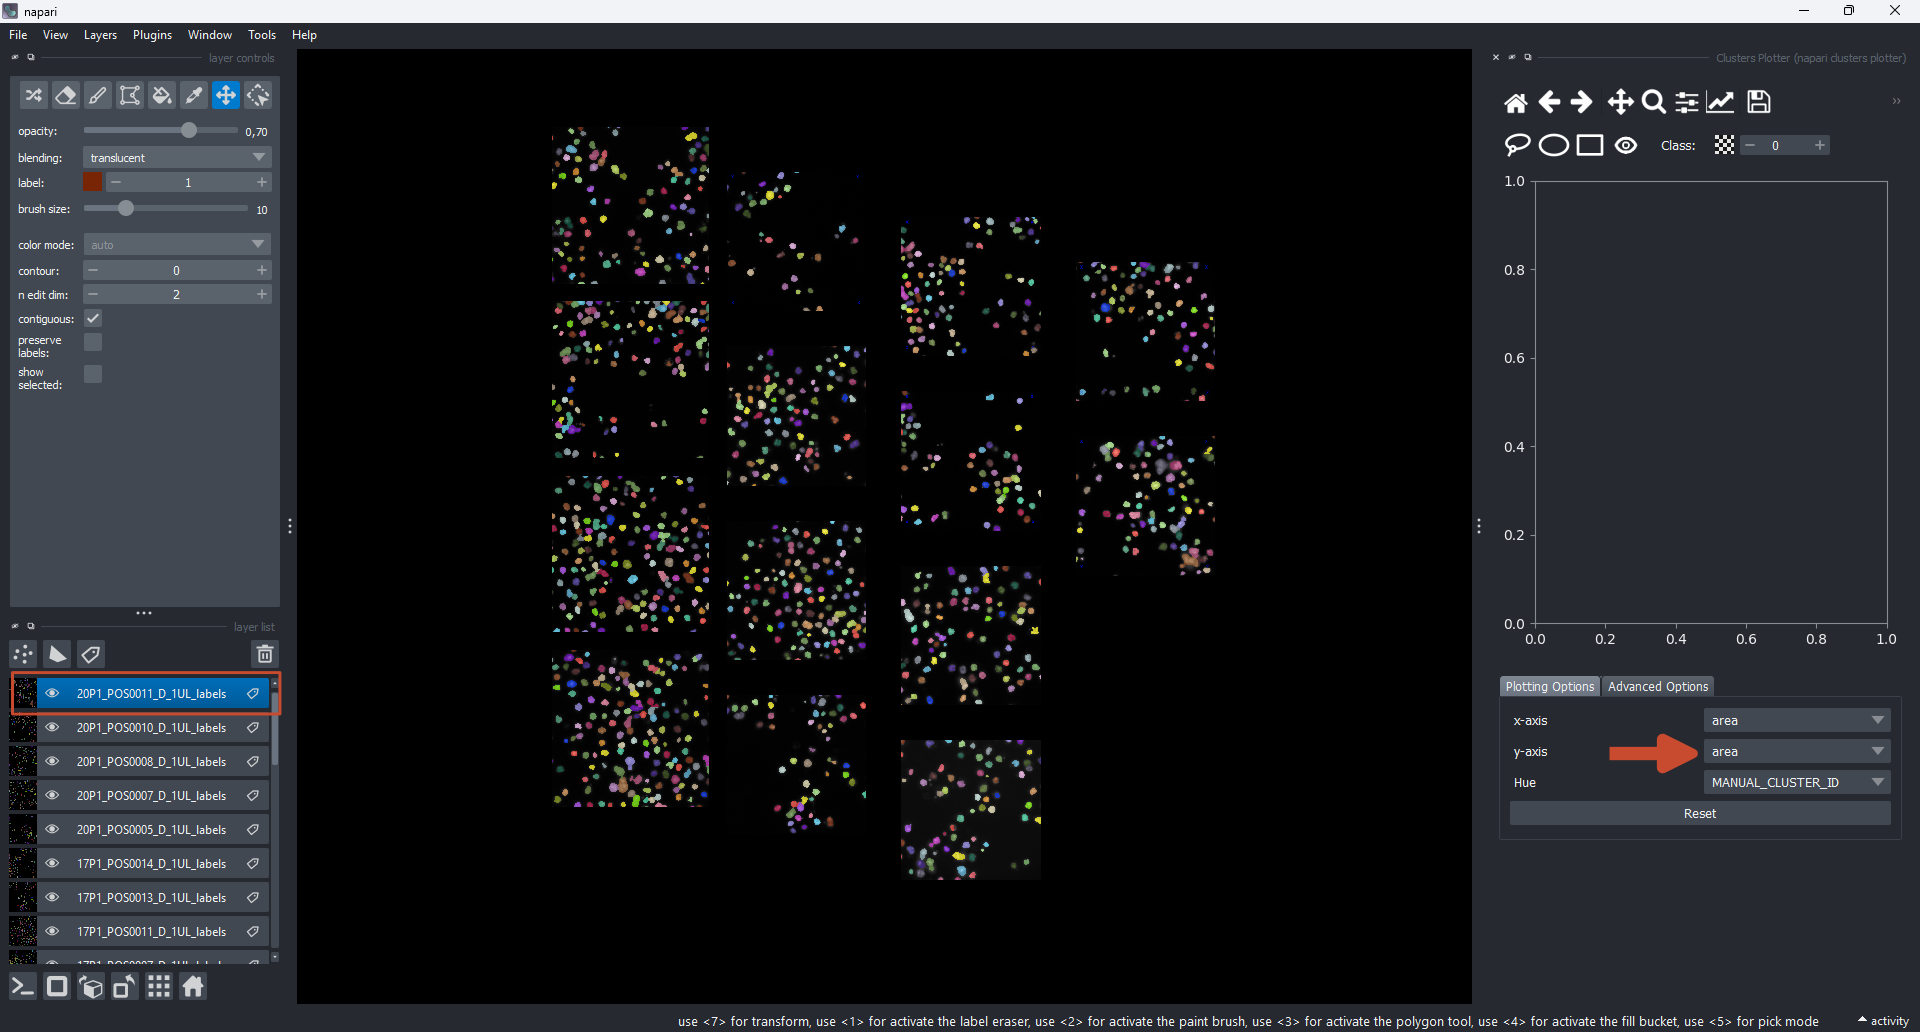
The dropdown menus for x-axis, y-axis and Hue are then automatically populated with all available features. The features will be drawn as soon as you make the first change to the selected features. By default, the MANUAL_CLUSTER_ID is selected as the Hue value. This features stores all the drawn/selected items.
For Label layers, we can observe that the initial random label colors are retained by default (i.e., the selection overlay is invisible by default):
When we start drawing or untoggle the visibility button, we see the respective items showing up in the color we selected as cluster index (see above). If we want to reset the selection, we can press the Reset button. For Labels data, the color will revert back to the default (random colors) as soon as the layer is unselected. To retain the cluster selection, simply keep the layer selected in the napari layer list.
Cross-layer visualization#
A key feature of the napari-clusters-plotter is that you can select multiple layers of the same type and explore their features with the Plotter Widget. To do so, simply select multiple layers in the layer list of napari. Again, the aforementioned sample dataset (BBBC1 dataset & segmentations) is suitable to give this a try.
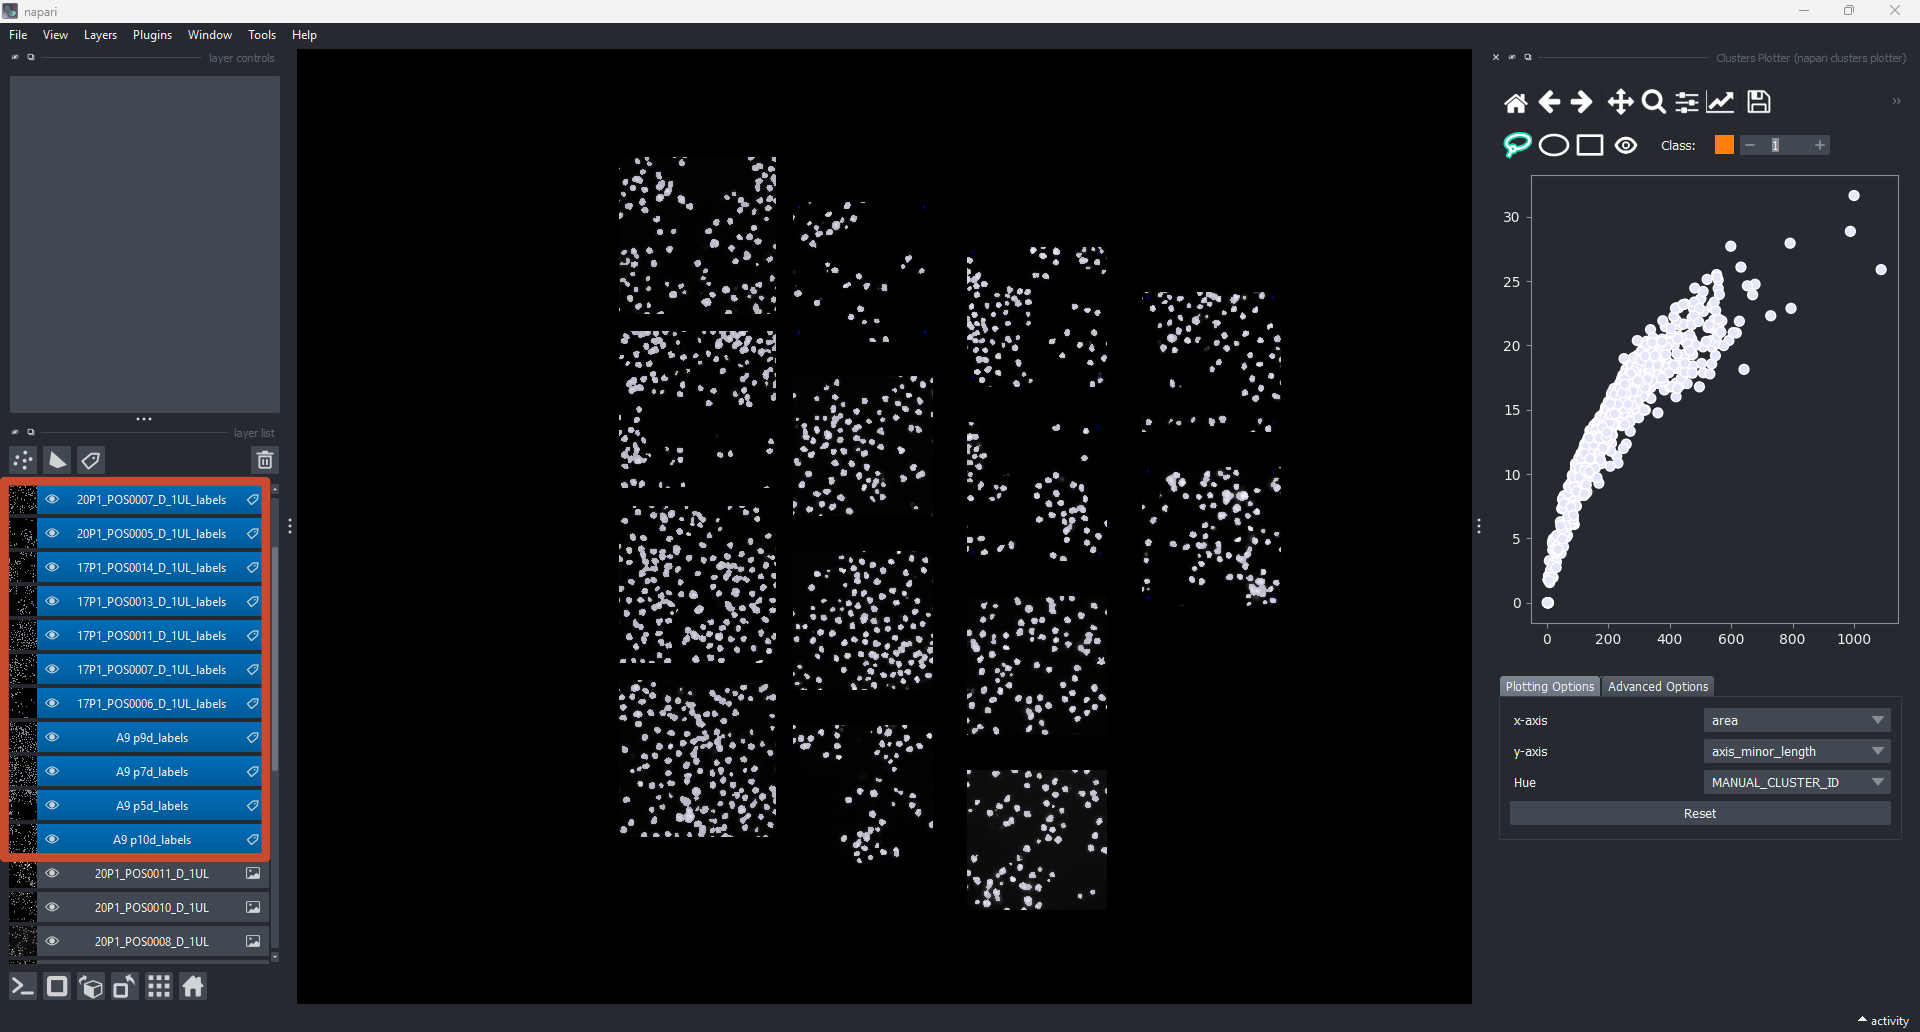
There are two things to keep in mind here:
The features available for visualization is the intersection of all features that are common to all selected layers. If a feature
feature_xis not present in all selected layers, it will not be available for visualization.Only features from the same layer type can be compared. If mixed layer types (e.g.,
LabelsandPoints) are selected, the drawing will fail.
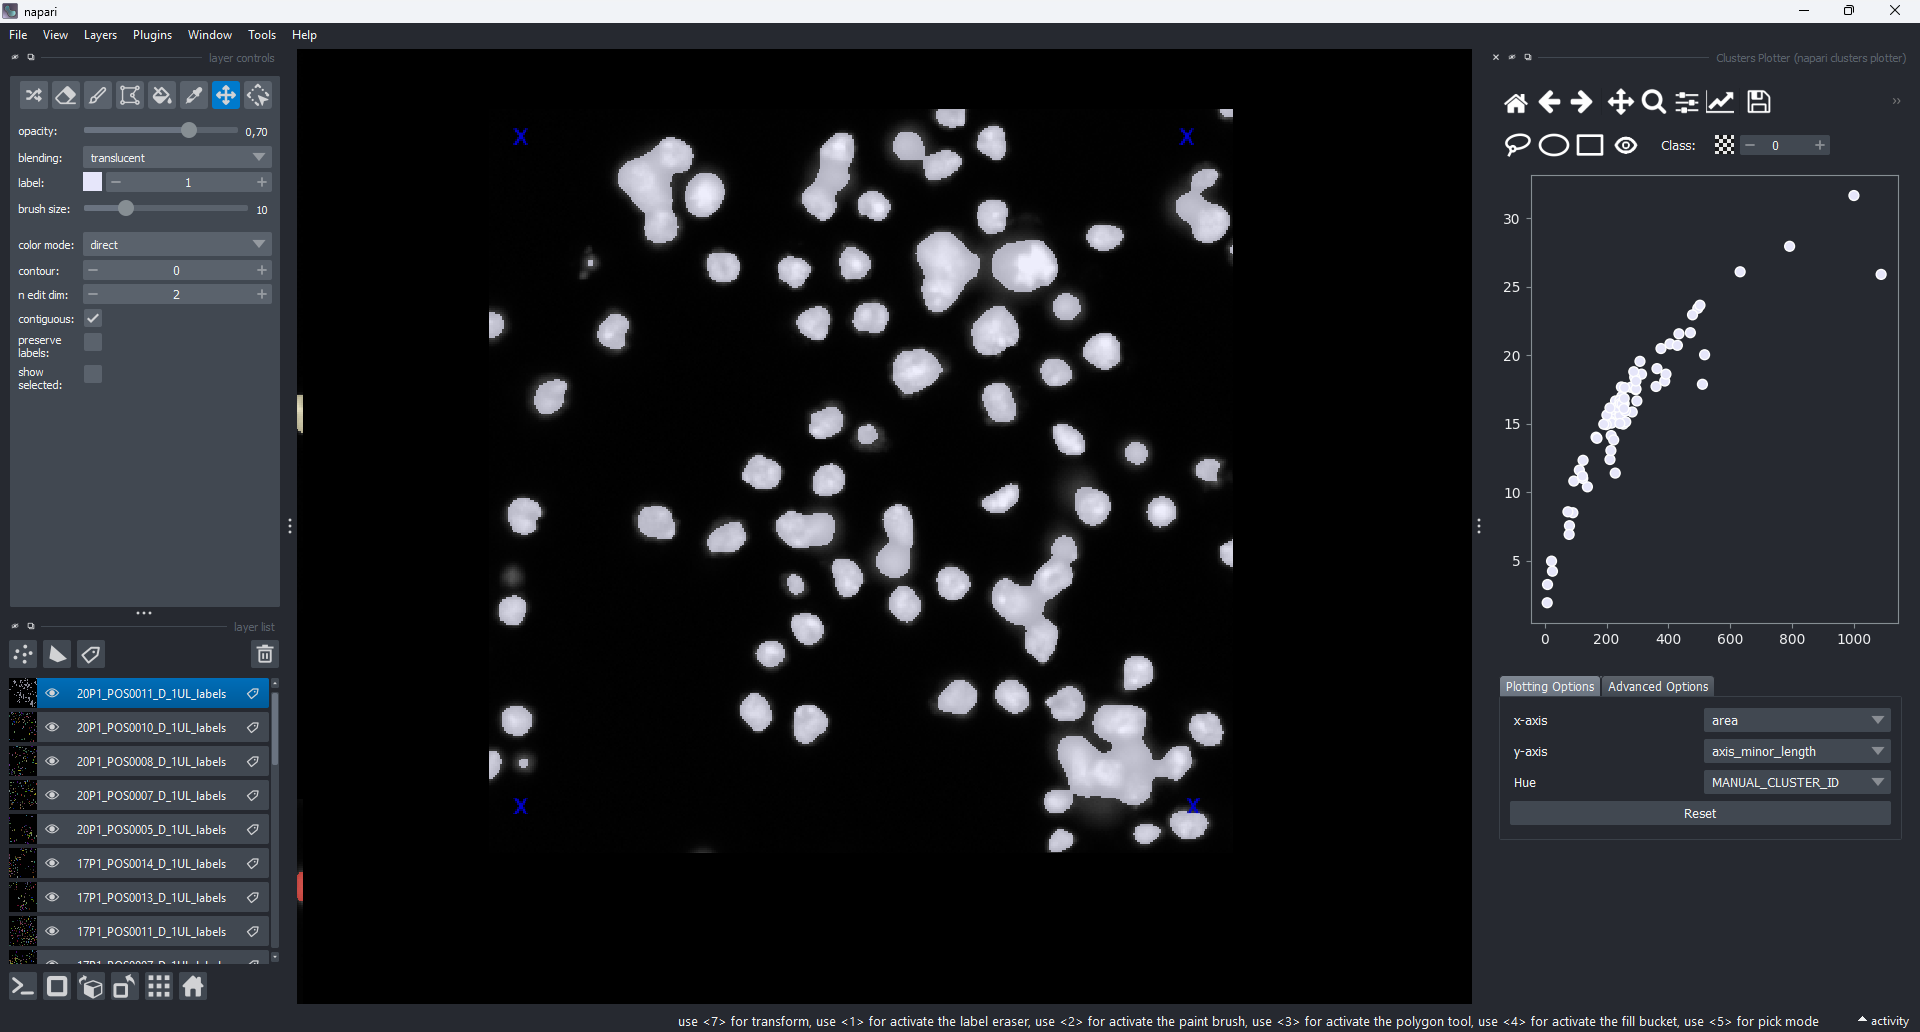
Visualizing non-categorical features#
So far, the Hue selector was always set to MANUAL_CLUSTER_ID, which is by design a categorical column. However, the napari-clusters-plotter supports visualizing any feature as the Hue parameter. If this is done, the points are colored according to the selected feature and each point’s color will be project on the respective object in the napari viewport. In essence, this creates feature maps for each feature you select:
Adding objects to new layer#
If you want to copy selected objects to a new layer, you can use the Add current class to new layer button in the Plotter Widget. To use it, make sure you have a categorical feature selected in the Hue dropdown selector (i.e., MANUAL_CLUSTER_ID, which is generated upon drawing a selection). However, resulting cluster ids from a clustering operation (see Clustering Widget) can also be used here. Generally, categorical features are highlighted in orange in the Hue dropdown selector:
Then, select the cluster id you want to copy to a new layer in the Selected cluster index selector (see above):

Finally, click the Add current class as new layer button.
Note
It is possible to export all unselected objects to a new layer, too. To do so, simply select zero as the Selected cluster index. This will copy all objects that are not part of any selection to a new layer.
Note
Selecting a cluster id that is not present in the Hue column will result in nothing happening.